-
TrackoBit
Manage commercial vehicles with the new-age Fleet Management Software
TrackoBit -
TrackoField
Streamline your scattered workforce with Field Force Management Software
TrackoField -
Features Resources
-
Blog
Carefully curated articles to update you on industrial trends. -
White Paper
Insightful papers and analysis on essential subject matters. -
Glossary
Explore an alphabetical list of relevant industry terms. -
What’s New
Get TrackoBit & TrackoField monthly updates here. -
Case Study
Explore the cases we solved with our diverse solutions. -
Comparisons
Compare platforms, features, and pricing to find your best fit.
-
About Us
Get to know TrackoBit: our team, ethos, values, and vision. -
Careers
Join the most dynamic cult of coders, creatives and changemakers. -
Tech Support
Learn about our technical support team and services in detail. -
Events
Check out the exhibitions where we left our marks and conquered. -
Contact Us
Connect with us and let us know how we can be of service.
Must-have Metrics and KPIs on Field Service Dashboard – Enabling Faster Decision Making
- Author:Shivani Singh
- Read Time:7 min
- Published:
- Last Update: April 1, 2024
Table of Contents
Toggle
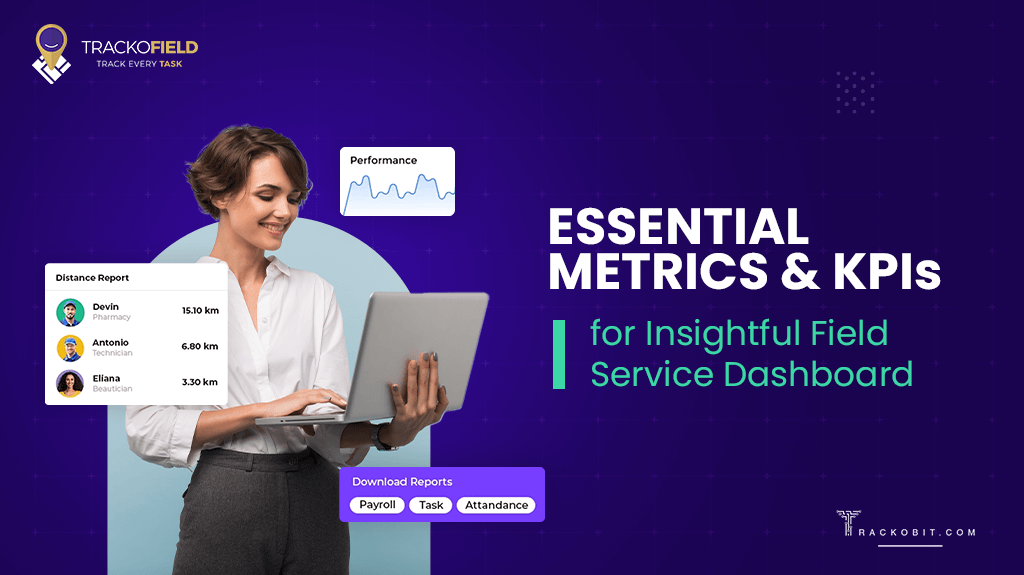
Equip your field service business with a customizable dashboard and essential metrics and KPIs that help in streamlining overall operational workflow, productivity, and growth.
Table of Contents
Toggle
The greatest power of the dashboard comes from its ability to illustrate things we usually tend to overlook or miss out on. That’s why new-age businesses get an overview from the dashboard to identify crucial patterns, potential setbacks, and probable opportunities to make faster business decisions.
Similarly, field service-based organizations resort to metrics and key performance indicators (KPIs) in numbers, figures, and charts illustrated on the dashboard. Upon churning out these KPIs, field companies get a detailed insight into employee performance, on-field productivity, best and worst performers, etc. Consequently, they can quickly monitor, examine, and enhance their overall business flow.
Essential KPIs and Metrics for Field Service Dashboard
The field service dashboards offer actionable insights into various aspects of field services enabling data-backed choices. Here are a few of the most popular metrics that help estimate the performance of your business.
A. Field Service Key Performance Indicators – From Customer Service POV
- Number of Tickets Raised
You may not predict the exact number of complaint tickets going to pour in tomorrow. However, accurate and well-sorted real-time ticket data can streamline task scheduling and resource allocation for managers. Having those live ticket counts on the dashboards keeps managers on their toes round-the-clock.
- Number of Tickets Resolved
It depicts the total number of tickets technicians or agents resolve during their working hours or within a stipulated time. The most crucial KPI to analyze actual team productivity. It helps deduce an understanding of Target vs Achievement on team and individual levels.
- Net Promoter Score
Net promoter score is a standard benchmark companies use to measure customer willingness to recommend a product or service to their friends, family, and colleagues. Having this score on the dashboard is like a real-time progress report depicting regular analysis of on-field activities. It’s crucial for start-ups as every customer or feedback is vital.
- Customer Satisfaction Score
CSAT score calculates and measures customers’ sentiment towards your product or service. It involves a simple question, “On a scale of 1-5, how likely are you satisfied with our product/services?” After reviewing customers who responded with low scores, companies can highlight significant loopholes in their service patterns. Thus, make strategies to deal with them.
B. Field Service Technician Metrics – Essential Technician KPIs
- Target Vs Achievement
This KPI assists in calculating achievements (completed tasks) against the target allocated. With such information at your fingertips, you can spot the total number of tasks in the pipeline. This lets you plan out the workload for the next few days/weeks, shifts for employees, and so on. Consequently, you are more likely to churn out the most productivity from your team.
- Site Visits by Technicians
The number of sites visited by technicians in a day helps evaluate their performance. For instance, Sahil visits 7 locations on Monday, however, Rinku and Mohan only reach 5 or 6 locations. So, by just getting a glimpse you can simply locate the sites visited by individual technicians. It also helps in assessing each technician’s productivity.
- Average number of work orders
Having a higher number of work orders closed per day directly impacts customer satisfaction. Managers can simply look at it, get the numbers in hand, and evaluate how many orders have been closed. If any day minimal orders are closed, managers can strategize to cover the rest and more on the next day.
- First-time Fix Rate
| First-time Fix Rate = Number of service calls that don’t need a second visit/Total number of service calls |
FTFR applies when a technician resolves an issue right away without any follow-up visits. In layman’s terms, it calculates the success of field workers in completing a job without having to either delay or cancel the task. This metric helps companies complete more tasks in less time, positively impacting the customer’s experience and reducing the risk of losing clients.
Note: A recent study claims that companies with an FTFR of over 70% attain a customer retention rate of 86%.
- Mean Time-to-Repair (MTTR)
| Mean Time-to-Repair = Total time consumed on maintenance or repair/Number of repairs |
This field service metric shows the technician’s average time to evaluate and repair the failed equipment. With this KPI, getting insight into how quickly your technicians respond to equipment breakdowns becomes convenient. Higher MTTR means technicians are taking more time to resolve the issue. It can be due to their outdated skills. Analyzing the problem area lets you conduct training programs for technicians so they can smoothly manage and complete their schedules for the day.
- Total Distance Traveled By Field Employees
Via distance traveled reports, you can instantly comprehend the total number of miles or distance traveled by field technicians. This also helps in reviewing expenses incurred by technicians during their journey. Validating expense claims against the distance traveled reports help you detect fraud. Moreover, you can better analyze your employees’ productivity during their working hours with the locations covered by them.
- Idle Time Detection
| Idle Time Detection = Standard hours – Actual working hours |
The time tracking feature in the field service management software provides insight into technicians’ idle time. It helps in spotting unproductive, underutilized, and lackluster technicians. Companies can use this field service metric to ensure their allocated technicians effectively utilize their time. Besides, companies can avoid overpayment to employees who are not actually working during their relevant on-duty hours.
C. Field Service Metrics for Human Resources – Evaluate Staff Productivity
- Absenteeism Rate
With the absenteeism metric, you can measure how often your executives are absent from work due to sickness, vacation, injury, or personal issues. A higher absenteeism rate can harm overall operational productivity. However, with attendance and leave management system, you can define flexible leave modules and thus prevent employees from taking unnecessary leaves.
| Note: An all-inclusive field service software like TrackoField offers plenty of ways for executives to mark attendance on the go such as geocoded attendance marking, biometric attendance marking, and visual verification. |
- Expense Per Unit
Expenses can eat up your company’s profit when you don’t use any metrics to track them. A field service dashboard equipped with expense per unit KPI provides insights on the average amount of expenses employees incur during their working hours. It helps you assess the ups and downs of your expenses to build a planning phase in response to the numbers received. Analyzing it constantly helps your company minimize its expenses and grow at a steady pace.
- Payroll Accuracy Rate
| Payroll Accuracy Rate (%)= No. of correct payments made per employee/Total no. of employees paid x 100 |
The payroll accuracy rate ensures that employees get paid accurately and on time for their actual working hours. A lower payroll accuracy rate may indicate manual method, error-prone practice, lack of resources, etc. However, companies with payroll software can automate the entire procedure from fetching employees’ accurate working hours to converting them into payouts. Thus, it reduces the probability of errors.
Why Do You Need TrackoField’s Field Service Dashboard?
With TrackoField’s field service dashboard, you can get data from multiple task locations that are easily accessible on your specific devices. It’s like a data visualization tool that helps you assess your field service business performance anytime anywhere.
The software creates real-time reports to monitor your executives’ or technicians’ productivity. You can view up-to-date data and sync it with different applications via API for a streamlined workflow. For instance, you can get data on executives’ expenses during their customers’ visits. By integrating it with payroll software, you can compute full and final payments to your executives.
TrackoField’s field service management software also helps in leveraging custom analytics that is tailored to your specific business needs. Thus, it lets you act on KPIs more conveniently and practically.
Final Words!
With the right field service metrics, you can spot loopholes, inefficiencies, and faults in your service processes. Thus, enabling you to turn flaws into opportunities with the help of data. In a nutshell, you can track the health of your organization and make better decisions for an improved workflow.
Wondering, where to find the right field service management software that offers you the dashboard of your dreams? Hmm! Talk to the experts at TrackoField. It’s a smooth sail from there onwards.
FAQs
-
What is a field service dashboard?
Field service dashboards allow field service businesses to get real-time and intelligent insight into their business models. It provides metrics and performance trends across all core functions that ultimately help in improving service delivery, locating unnecessary cost inefficiencies, and improving executives’ morale.
-
Why are implementing field service reports & dashboards important?
Here are the potential reasons and advantages of field service dashboards and reports.
- Measure executives’ performance in a shorter time frame
- Track the time to resolution, detect executives’ idle time, and provide insights into the absenteeism rate
- Give a realistic look at the overall status of your business, from risk factors to opportunities.
- Let you see your successes and failures to acknowledge what is really working
-
What are field service key performance indicators?
Field service key performance indicators help in measuring the performance of field service businesses in terms of absenteeism rate, customer satisfaction score, net promoter score, mean time to complete a task, etc. Upon analyzing these KPIs, businesses can create milestones to gauge progress and prefer data-based decision-making that helps them grow further.
Shivani is a Content Specialist working for TrackoField. She comes with years of experience writing, editing and reviewing content for software products. Her underlining expertise in SaaS especially H... Read More
Related Blogs
-

How to Track Field Employees Offline With Field Force Management Software
Mudit Chhikara February 11, 2026Use field force management software to track field employees offline and ensure managers never lose visibility of on-ground operations.
-

How AI-Powered Field Force Management Simplifies Field Operations With Analytical Dashboard
Mudit Chhikara February 10, 2026How AI-powered field force management enhances field operations using AI manager bot and analytical dashboard.
-

Grameen Credit Score and the Quiet Redesign of Rural Lending
Pulkit Jain February 9, 2026Rural lending doesn’t usually go wrong at approval. It drifts when what’s happening on the ground stops being visible.
-

How NBFCs Can Reduce NPAs Using LMS + LOS + FFA Integration
Mudit Chhikara January 30, 2026Here’s how NBFCs can smartly integrate LOS, LMS, and FFA software to reduce NPAs and ensure seamless field operations.

Subscribe for weekly strategies to boost field team productivity.
Your inbox awaits a welcome email. Stay tuned for the latest blog updates & expert insights.
"While you're here, dive into some more reads or grab quick bites from our social platforms!"Stay Updated on tech, telematics and mobility. Don't miss out on the latest in the industry.
We use cookies to enhance and personalize your browsing experience. By continuing to use our website, you agree to our Privacy Policy.


