Quick Summary
- TrackoBit offers a dual-dashboard system for fleet management, combining traditional and analytical features for enhanced user experience.
- The traditional dashboard provides real-time vehicle status and categorization, aiding managers in efficient fleet navigation.
- The analytical dashboard delivers actionable insights through graphical reports, optimizing fleet operations and decision-making.
- Utilizing both dashboards enhances time efficiency, comprehension, and productivity, making TrackoBit a leading choice in fleet management solutions.
“You never get a second chance to make a first impression.” We could not agree more with Will Rogers.
The dashboard is the first thing users access when they open their fleet management system. But most dashboards fulfil the sole purpose of redirecting users to their desired feature or solution. TrackoBit, on the other hand, has so much more to offer.
While most software will constrict you with just one dashboard, operating either traditionally or consisting of analytics, we offer you the best of both worlds, providing users with two dashboards instead of one. Sounds confusing right? Don’t worry, this blog contains all the information you need for understanding the operations of our dashboard.
Traditional vs Analytical Dashboard
Let us begin by understanding what we are trying to portray when looking at traditional and analytical dashboards and how they differ from each other.
Traditional Dashboard
The major role a traditional dashboard serves is that it helps managers navigate their fleets better. It has a list of vehicles and their basic information. This information might be categorised which can make it easier for managers to search for specific vehicles. Ultimately this type of dashboard is very suitable for fleet businesses whose primary requirement behind using fleet management software is GPS tracking and data storage.
Analytical Dashboard
With an analytical dashboard, managers get actionable insights into their fleet via graphical representation. This is most suitable for fleets that use the system primarily to optimise their fleet operations. Managers can study the reports available on the dashboard to make knowledgeable decisions. For example, if a report suggests that the fleet is lacking time efficiency, then measures can be taken to rectify this.
Now we have a basic idea about the role each type of dashboard plays in fleet management. Still don’t know what is best for you? TrackoBit has your back. We have incorporated two dashboards into our system that both serve very different functions. Businesses can navigate their fleets and also get insight into their fleets.
Features Offered by TrackoBit’s Traditional Fleet Management Dashboard
Sharing information with their users is not what most dashboards are expected to do. This is why having a traditional dashboard is an added benefit to all the other ways TrackoBit helps fleets optimise their operations.
With an array of features readily available at the managers’ fingertips, the dashboard can be used to access actionable insights into one’s fleet. Let us look at all the individual features it has to offer:

Vehicle Status
This section is divided into a list, categorising vehicles according to their current live activities. Some of the categories mentioned in this list are:
- Vehicles Running
- Idling
- Overspeeding
- Stopped
- Unreachable
Such categories help managers sort their vehicles based on their activities. They do not have to waste their time manually separating their on-duty vehicles from the available ones. This systematic segregation also gives them a quick view into their fleet’s productivity and driving practices.
Map
Textual information can be difficult to manage and understand, especially if a manager’s goal is to save time during the tracking process. This is why the traditional dashboard of a vehicle tracking system contains a map that helps them get a visual representation of their vehicles’ whereabouts. Several kinds of views also make the map reading experience of the managers easier. The views include:
- Satellite: See the actual image of the map and not just a virtually drawn-out map.
- Traffic: View how much traffic is blocking their designated routes. Thus, reroute your tasks accordingly.
- Play: Physically trace the journey of your vehicles on the map.
- Clustering: Group together several vehicles present in the same region for better understanding.
- POI: See where you have added POIs on the map.

Vehicle Details
Quick access to the details of all vehicles can be very time efficient for managers and fleet business owners. This means that the managers will get actionable insight at the ease of a couple of clicks and do not have to extensively browse for simplistic data. Some of the data readily available for managers are:
- Fuel: Managers can see the real-time fuel level of their vehicles right from their dashboard. They do not have to dive into fuel reports for such a mundane task.
- Distance From Last Stop: In case a vehicle loses connection to the system, managers can see their last location and the duration of lost connectivity.
- Speed: The speed at which drivers are driving their vehicles is very vital now. Managers must stay aware to see if a driver needs to be instructed to adhere to rules and regulations.
- Odometer: It becomes easier for managers to keep track of the total distance their vehicles have covered through odometer readings.
- Lock status: Whether a vehicle is locked or not is very essential to keep track of. This is because if a vehicle is supposed to be parked but is still unlocked, there is a chance of theft or resource wasteful activities.
- Battery and Network: Battery and network status ensure that in case of a lost connection between vehicle and system, managers are aware of the reason. This can be due to a poor signal or a dead device.
Travel History
These reports contain a summary of the vehicle’s activities. They allow managers to understand their driver activities as well. Studying this report can help managers see whether they need to make changes to their fleet or not.
The system allows managers and owners to download their actionable reports. These reports are categorised into segregated columns, making them easy to interpret and optimise fleet operations. Thus, these reports can prove to be useful even when the manager is offline. The download feature also makes it easier for managers to communicate information as they can send copies of reports to people with no access to the system easily.

Nearby
In case of emergencies, do not leave fleets to fend for themselves. The nearby feature accessible right from the dashboard allows managers to see all the facilities available near a vehicle’s live location. The services listed under this feature are:
- Vehicle
- ATMs
- Petrol Pumps
- Hospitals
- Police Stations
- Service Points
- Shopping Malls
- Restaurants
- CNG Stations
A use case of this feature can be any accident. Managers do not have to spend time searching for resources available near their vehicles. Instead, this feature can immediately help them see the hospitals nearby and they can send help to their drivers on time.
What is TrackoBit’s Analytical Dashboard?
We have already discussed the basic functioning of an analytical dashboard. But what exactly does this dashboard offer? As users, fleet owners have full control over the kind of report they would like to see on their dashboards. This means that there is no list of set reports reflected on our analytical dashboard. But here is some data most commonly used with this dashboard:
- Total Distance Travelled: Managers get information on the composite distance covered by a fleet in just a glance. Not just that, this information can further be divided into the distance covered by each vehicle in the given number of days (a week, month or over several months)
- Mileage Reports: This graphical representation of the fleet’s mileage can help managers change their fleet’s functioning to maintain/increase these numbers. This system makes it very easy for managers to compare their fleet’s fuel usage over time, making fleet management time efficient.
- Driver Behaviour Analysis: Tracking drivers’ activities on road is an essential part of managers’ jobs. But collecting and summarising such information can be very wasteful. The analytical dashboard graphically encapsulates this information so that they spend less time studying data and more on optimising their fleet.
- ADAS and DMS Analytics: On-road practices of drivers can also be tracked using their video telematics analytics. This report allows managers to see how many times a driver was distracted while driving, thus endangering the vehicle’s safety. It also lets them know how many times the driver jumped lanes or violated traffic signals.
- Custom Analytics: Don’t find the reports you want? Well, we can always customise them for you. Design your dashboard by choosing what reports you require for efficient management.

What are the Benefits of Using Traditional and Analytical Dashboards?
Having a combination of traditional and analytical dashboards can reap many benefits for a fleet business. The benefits we have listed below are just the tip of the iceberg. Let us have a look:
- Real-time information: All the data available on the traditional dashboard is in real-time. This means that managers do not have to worry about continuously communicating with their drivers about the live status of their vehicles.
- Auto-Updating: The information does not have to be manually stored or refreshed from time to time. Instead, the system itself updates the information as it receives data from the hardware.
- Time Efficiency: Users save a lot of time that was previously wasted in manually collecting data for analytics. The analytical dashboard does all the work for you now. Manages also save time previously wasted accessing reports under each individual solution. Instead, the data is now encompassed on the dashboard itself.
- Better Comprehension: Structured data allows managers to understand their fleet better. They can make insightful decisions based on studied information, thus reducing the chances of errors.
- Enhanced Productivity: With more time in hand, managers can focus on several operations of the fleet simultaneously.
Shift to TrackoBit Right Away!
A dashboard definitely plays a crucial role in a fleet’s functioning. This process can be further simplified with the use of TrackoBit’s two-dashboard system. An analytical dashboard is an amalgamation of all the good elements of a fleet management system. It allows managers to save time and boost their productivity simultaneously. A traditional dashboard presents you with real-time categorised information.
TrackoBit is the leading fleet management in the market. Its dashboard has all the features you might need to make your optimisation process easier. With customisation, craft the software to fit your business like a glove, completely transforming how it functions. Request a demo today!

Drishti Dua, a Content Contributor at TrackoBit has a rich background in literature and professional expertise in SaaS and technology writing. She has carved her niche in the space of Geospatial techn... Read More
Related Blog
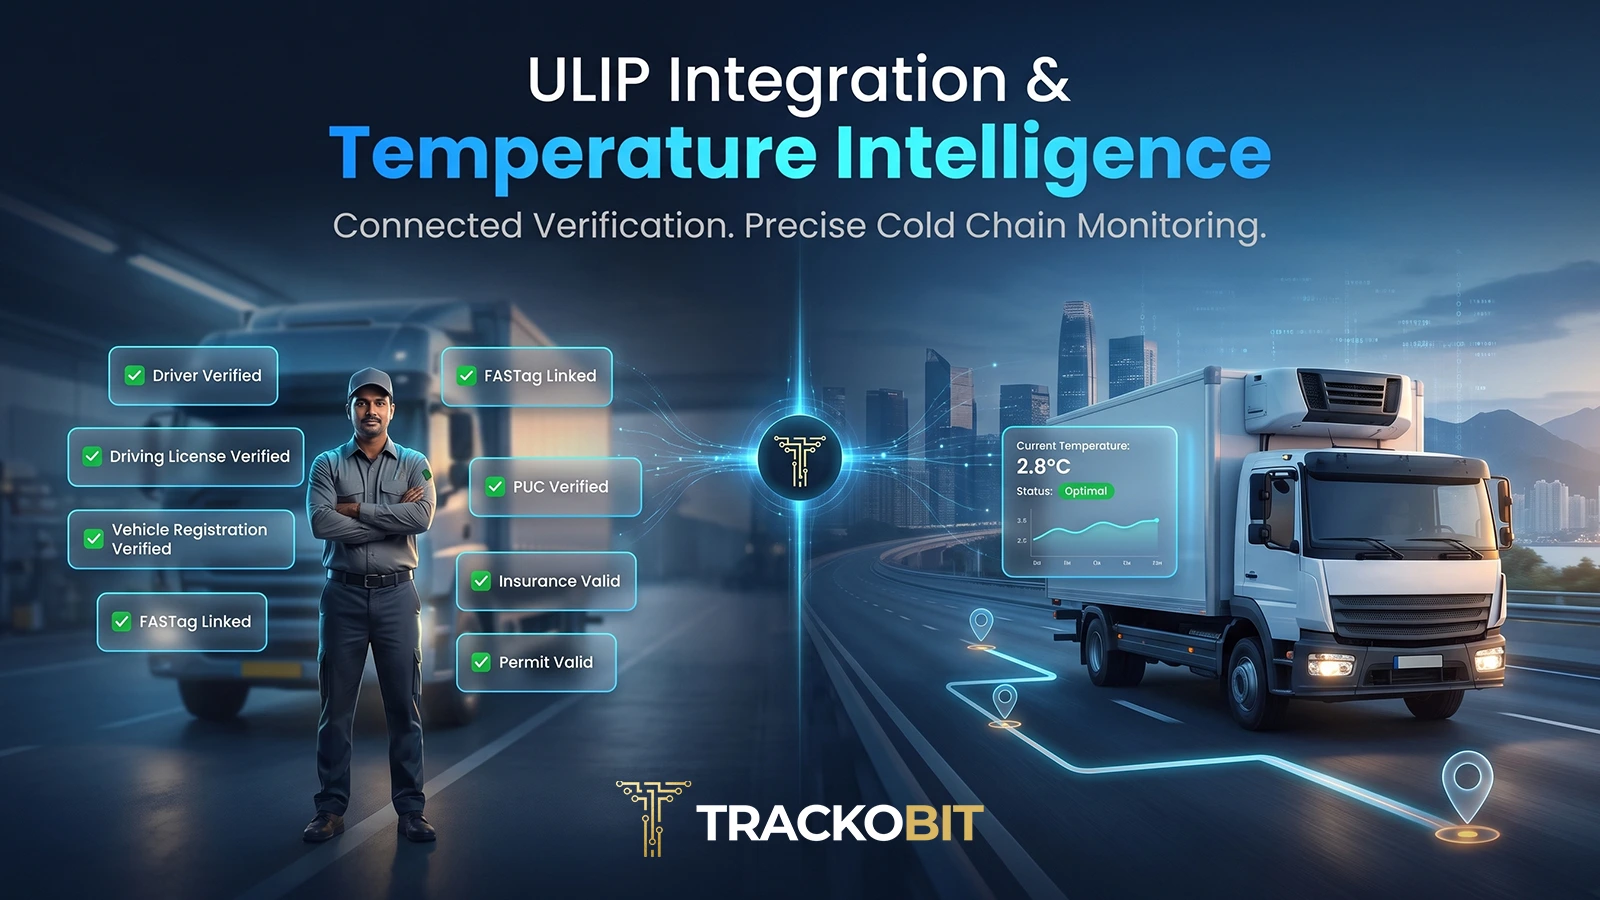
ULIP Integration & Temperature Vs Distance: Now Live in TrackoBit
Simplify fleet verification and cold chain monitoring with TrackoBit’s latest release. Align driver and vehicle records with national logistics infrastructure,…
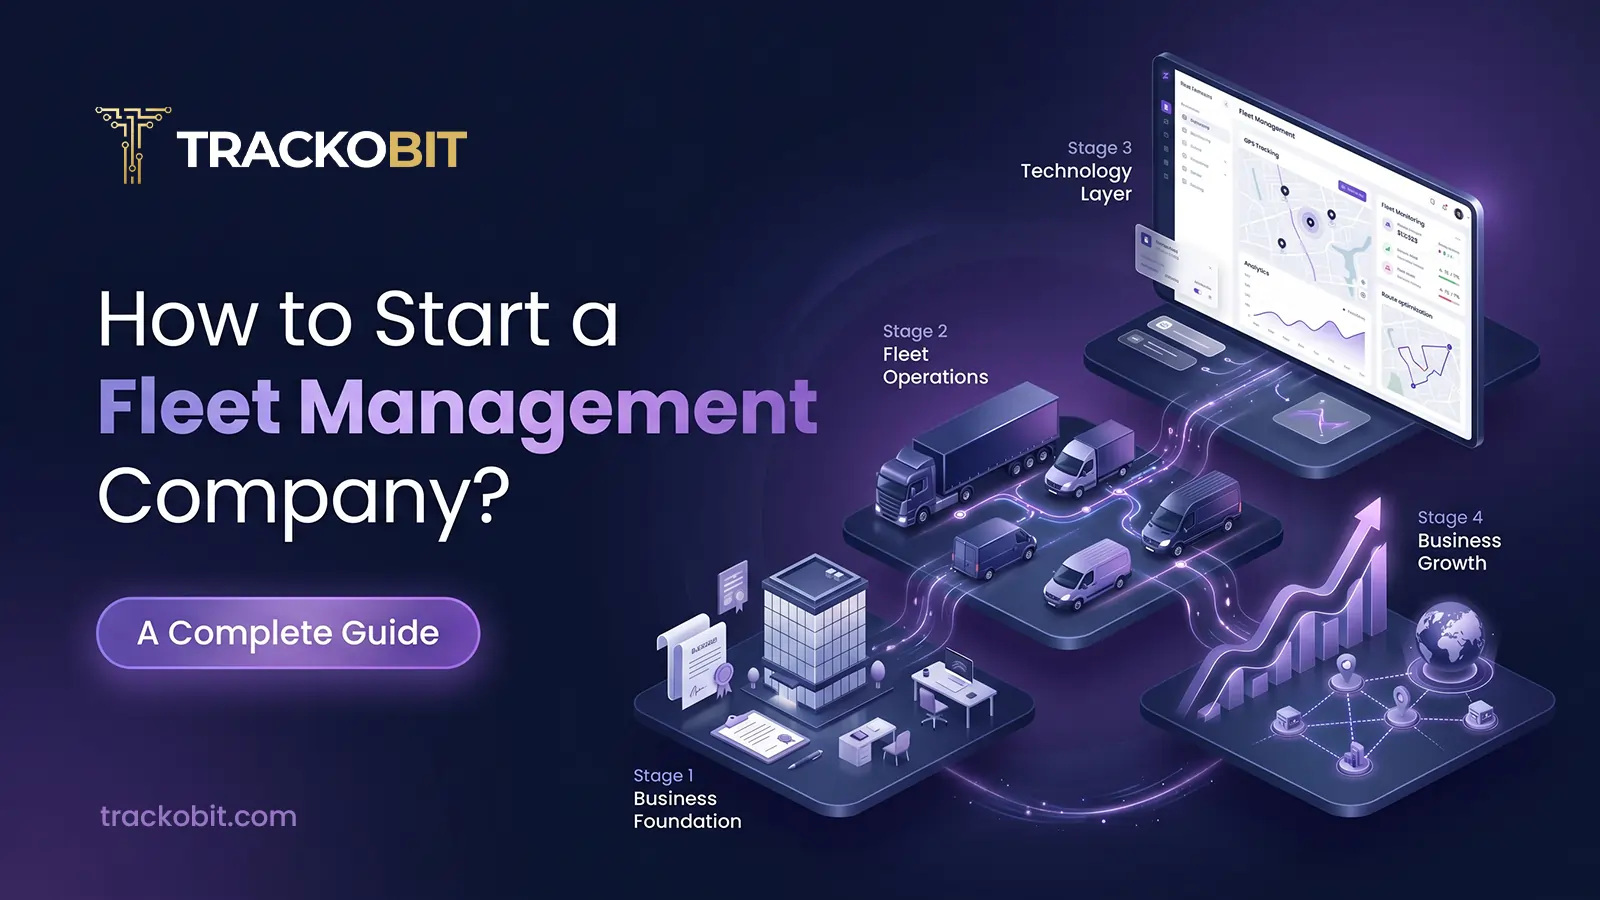
How to Start a Fleet Management Company: Step-by-Step Guide
Wondering how to start a fleet management company? You’re at the right space. We have covered 10 simple steps to…

Indian Companies Don’t Refuse to Pay for Software. They Refuse to Be Burned Twice.
Indian companies are not slow to buy software because of price. They are slow because they have been burned before,…
How TrackoBit Turns Driver Data into Better Fleet Performance
Discover how driver scorecards, RAG, BRAG, and performance reports help fleets reduce risks. And how TrackoBit’s driver performance suite improve…

Your inbox awaits a welcome email. Stay tuned for the latest blog updates & expert insights.
"While you're here, dive into some more reads or grab quick bites from our social platforms!"Stay Updated on tech, telematics and mobility. Don't miss out on the latest in the industry.