July was a big month for TrackoBit!
We rolled out smarter reports, key mobile features, and more ways to stay in control. Latest updates in July – data customization to cost tracking and driver performance reports- made fleet management smoother and simpler.
Here’s a quick look at what changed.
Major Updates in TrackoBit’s Web App for July 2025
Update 1 – Custom Sensor Report
With the new Custom Sensor Report, you can customise every detail:
- Pick your date range, report type, sensors, and data fields.
- Select as many columns as you want – no more limits of 5 or 10.
- Add custom sensors for any vehicle and include their data in one click.
- Name your report for quick recall and easy sharing.
- Download it all in Excel – perfectly formatted.
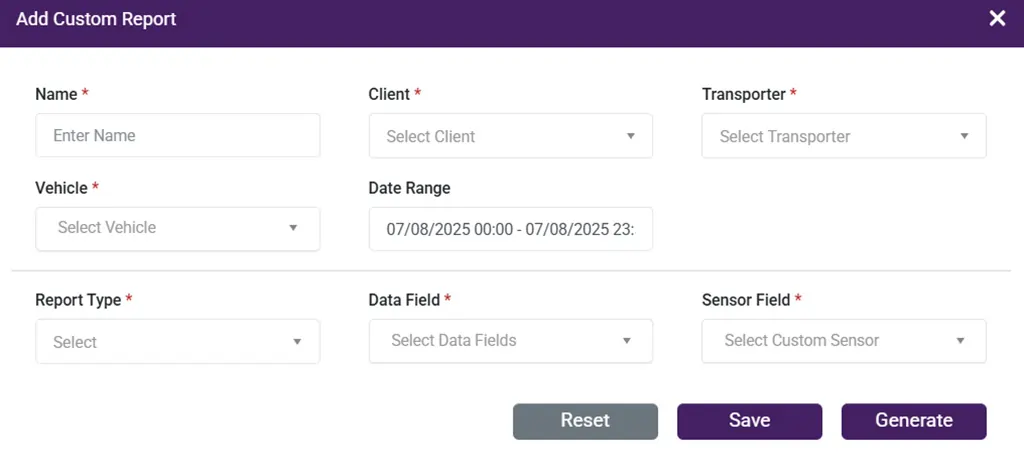
Select sensors to get custom report on them
Update 2 – Driving Performance – Easier Settings, Better Reports
By going to the Driver Score Settings, you can now set your rules and track driver performance more easily. This report is both driver-wise and vehicle- wise.
What’s new:
- Set your own limits – Decide thresholds for harsh braking, over speeding, DMS violations, ADAS violations, idling and more.
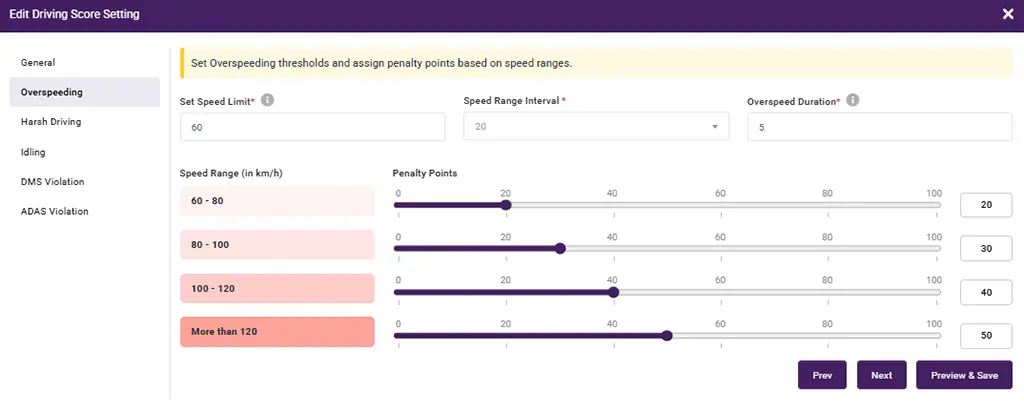
Set custom point for every violation
- Priority-Based weighting – Mark which ones matter more so the score reflects your priorities.
- Clear performance reports – View driver scores for any date range — daily, weekly, or monthly.
- See every violation – Get details of each penalty or incident so you can guide drivers better.
- Rank your drivers – Quickly spot top performers and those who need improvement.
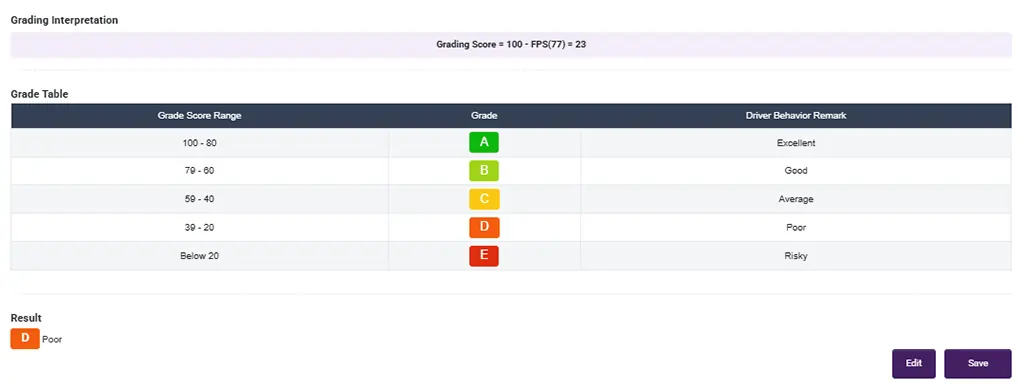
Get driver performance report and grade according to their performance
Update 3 – Historical Data Restriction – Custom Access Control for Transporters & Temp. Users
Now you decide how much historical data your transporters and temp. users can access.
- Set custom durations – from a week to several months.
- Applies to Android, iOS, Web, and Mobile apps.
Update 4 – Vehicle Expense Report – Track Costs as You Track Kilometers
Our new Vehicle Expense Report brings cost visibility right into your daily fleet ops.
Here’s what’s new:
- Define expense & maintenance cost per km for each vehicle in the ‘Add Vehicle’ section — covering everything from fuel, tolls, and driver wages to taxes and upkeep.
- Authority-based control ensures only authorized users can set or edit these costs.
- Daily, weekly, or monthly views — alongside the distance travelled, see the exact cost incurred for that period.
Benefit: Automatic calculations ensure accurate total cost per vehicle without juggling spreadsheets.
Example: If a vehicle costs ₹20 per km to run, you’ll now see exactly how much it’s costing you each day, week, or month — along with the distance covered.
With this update, you can go beyond mileage tracking to truly understand your fleet’s financial performance and make informed business decisions.
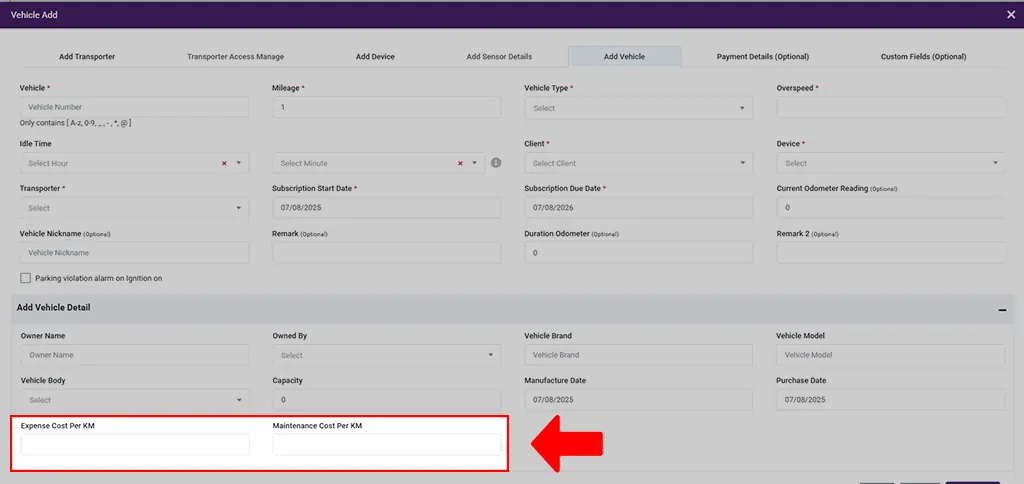
Define vehicle’s expense and maintenance cost per KM to easily calculate the expenditure
Update 5 – External Voltage Added to Fuel Chart
We’ve enhanced the Fuel Chart by adding external voltage readings alongside fuel level data.
What this means:
Earlier, you could only track fuel level changes — such as refueling or fuel usage — in the chart. Now, the same chart also shows the external power status.
Benefit: You can easily check if a fuel change (whether refuelling or emptying) happened while the GPS tracker’s external power supply was active or if it was disconnected.
You get a complete picture of events without needing to open multiple reports. It helps in identifying whether changes in fuel readings are part of normal operations or if they occurred under unusual power conditions.
Updates in Report Category
Update 6 – Ride Report – Multi-Vehicle View is Here
Now, you can:
- Select multiple vehicles at once and generate a single, consolidated report.
- Compare trips, performance, and patterns across your entire fleet in one go.
Update 7 – Status Report – Now with Max & Average Speed for Overspeeding
We’ve enhanced the Overspeed section in the Status Report to give you more detailed insights.
What’s new:
- Earlier, you could see when a vehicle crossed the speed limit you set (e.g., 40 km/h) and for how long
- Now, for every overspeeding incident, you’ll also see:
- Maximum speed reached during that time.
- Average speed maintained while overspeeding.
Example: If a vehicle overspeed from 4:00 PM to 4:15 PM and hit 70 km/h at its peak, you’ll see both the max (70 km/h) and average speed for that duration — all in one report.
This means you can track not just when and how long drivers overspeed, but also how fast they go during those moments.
Update 8 – Schedule Report – New Additions
Two new reports can now be scheduled: Unreachable Report and Status Report.
Update 9 – Email Status Reports Directly
Status Reports can now be sent directly via email without downloading them as Excel or PDF first. Share reports faster and save time.
Minor Updates
-
Address in iOS Notifications
iOS notifications now include the full address along with the vehicle number, time, and event details.
-
Temp User – Notification List Access
The Notification List, which shows all vehicle alerts in a table, is now also available to temp users and sub-users — not just transporters and clients.
-
New Language – Mongolian
Mongolian is now available as a language option in the platform across Android, iOS, web, and mobile apps.
What’s New in TrackoBit’s Android & iOS Application?
1. Target SDK Version Update
We’ve updated our target SDK to meet the latest Play Store requirements, improving security and overall app performance.
2. Howen Two-Way Communication
We’ve added two-way communication to Howen video telematics devices on Android and iOS. Drivers and clients can now talk directly through the in-vehicle camera.
3. Video Layout & Alarm Module Enhancement
Improved UI and navigation for a smoother experience, with clearer highlighting of active alarms in the module.
And That’s A Wrap up For July 2025!
With every update, we’re making fleet management smoother, smarter, and more powerful — across web and mobile.
And we’re just getting started. Stay tuned — more innovation is on the way in our fleet management software to keep your operations running at their best.


