Quick Summary
- Thematic maps focus on specific themes, visualizing data like income distribution and delivery dependencies for better spatial understanding.
- There are six main types of thematic maps: Choropleth, Bivariate Choropleth, Heat Maps, Dot Density Maps, Value by Alpha Maps, and Graduated Symbol Maps, each with unique advantages and disadvantages.
- These maps are crucial for industries like logistics and transportation, helping to convert complex data into digestible visuals for pattern recognition.
- Businesses can leverage thematic maps to identify trends and optimize operations, enhancing decision-making processes in various sectors.
Maps have come a long way, and their usage has gone beyond just navigating distances. Thematic maps are now being used to interpret data, gain information, etc.
Maps have come a long way from just being used in geography classes. They were used earlier for directions and going from one point to another. But that is not the case now as maps have advanced and elevated, they provide much more information and data.
Thematic maps have changed the whole game. These maps tell you exactly what you are looking for specifically. Keep reading this article to learn about the various kinds of thematic maps out in the market and which suits what requirements.
What is a Thematic Map?
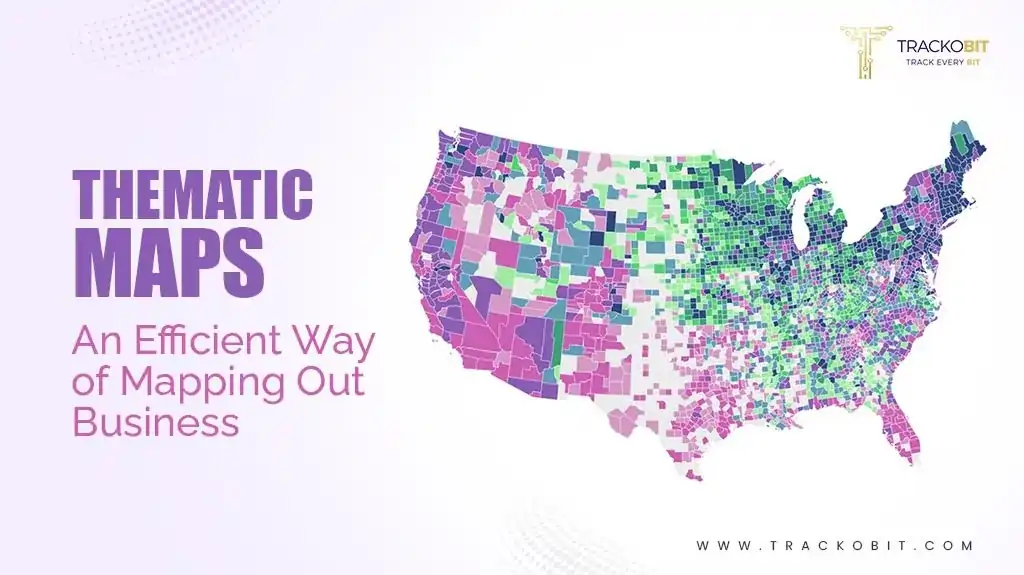
Thematic maps are single-topic maps that focus on specific themes or phenomena. They pull together relevant information, for example, income distribution, areas more likely dependent on deliveries, etc., and represent the data spatially to understand the relationship between these themes and their geographic locations.
The very reason we need thematic maps is that, from the same data, we can visualise 1000s of different thematic maps just by choosing to transcribe and put in a few more elements as per the map.
This is primarily why businesses and industries need thematic maps to convert non-visual data into a digestible visual form. It focuses on the selected theme and features only those reference points that must be communicated.
Industries that use spatial analysis and benefit from pattern recognition can leverage thematic maps. Such as
- Logistics and Transportation
- Supply chain Management
- Delivery Services
- Retail and Services Sector
What are the 6 Types of Thematic Maps?
1. Choropleth Maps

The choropleth map is one of the most commonly used maps in geospatial data. It uses colours to represent statistics proportionally to its location. It displays densities using colours. These maps convey statistical values in different geographical scales, from local to global.
Such maps are best used in conveying enumeration units like cities and countries, showing rates and ratios like sex ratio, etc.
Advantages of Choropleth Maps
- They clearly display densities of qualities using colours.
Disadvantages of Choropleth Maps
- The visual tends to generalise the data
- Geographical spaces aren’t uniform, so some areas may appear overrepresented.
2. Bivariate Choropleth Maps

Bivariate choropleths are similar to choropleth maps with one exception: unlike choropleth maps that use one variable, bivariate choropleth maps use two variables simultaneously. This sort of map compares two dissimilar distributions on a single map.
The best use case of Choropleth maps would be in exploring obesity and food insecurity rates at the same time. It would combine both attributes and use colours to indicate areas where both attributes are low or high.
Advantages of Bivariate Choropleth Maps
- They visualise two themes at once
- They’re aesthetically pleasing.
Disadvantages of Bivariate Choropleth Maps
- They can be complex and hard to read
- It is hard to have an interactive version of a bivariate map.
3. Heat Maps

A heat map represents an incident’s intensity within a dataset. It utilises colours to represent intensity. But unlike choropleth maps, a heatmap does not use geographical or geopolitical boundaries to group data.
This map is usually used when tracking weather and natural phenomena, as the established boundaries are irrelevant to understanding the impacted area.
Advantages of Heat Maps
- Heat maps simplify understanding of relations between data points and overall trends.
Disadvantages of Heat Maps
- If the colours are not used properly, it might affect the visualisation of the data.
- The colour transition might reflect the perception that is not there in the input data.
4. Dot Density Maps

Each data point is represented with a dot in this map, which is a great way to measure density. Regions with a large number of dots packed together are areas of high density, whereas areas with scattered or no dots are where the data is lacking.
Dot maps have been around for a long time and are still popular due to their simplicity and wide range of applications. They are highly effective in showing geographic distribution of density, population, demand, etc.
Advantages of Dot Density Maps
- It is the most reliable method to visualise spatial patterns.
- An effective way to represent different categories using colours.
Disadvantages of Dot Density Maps
- If the map lacks drawn borders, it will be hard to know exactly where the points are located.
5. Value by Alpha Maps

Advantages of Value by Alpha Maps
- VBA displays bivariate relationships with more than three classes.
- They are aesthetically pleasing.
Disadvantages of Value by Alpha Maps
- They are complex and hard to interpret
- It is hard to have an interactive version of the bivariate map.
6. Graduated Symbol Map

Graduated symbol maps are an alternative to choropleth maps. The difference is that the graduated symbol map uses points instead of colours to indicate feature attributes or statistics. This data is generally stored in polygons and then converted to centroid points for these areas.
These maps are famously used for representing earthquakes of varying magnitudes.
Advantages of Graduated Symbol Map
- It does a great job showing raw quantities
- They convey where and how much quantities.
Disadvantages of Graduated Symbol Map
- Not as exact as distribution maps
- They need preprocessing to derive centroids
- Overlapping circles create confusion.
Summing Up!
Thematic maps are a way of evaluating data much more effectively and gaining information otherwise impossible. There are a variety of thematic maps that businesses can use to benefit in recognising patterns, trends and demand and supply.
TrackoBit, a fleet management software, offers users all the above-mentioned maps and more. This is helping logistics, transportation and supply chain manufacturers efficiently conduct their business by channelling the data and information thematic maps offer.

Tithi Agarwal is an established content marketing specialist with years of experience in Telematics and the SaaS domain. With a strong background in literature and industrial expertise in technical wr... Read More
Related Blog

TrackoBit Integrates with VAHAN & SARATHI for Vehicle & Driver Verification
TrackoBit launches VAHAN and SARATHI verification. This is to help fleets build compliant operations with government-verified records.

What is an End-User License Agreement (EULA)?
EULA, or End-user license agreement, we all know, is a legal agreement granting users a software license and how it…
GPS vs NavIC: Global Reach vs. Regional Precision
Want to know what’s better, GPS or NavIC? This piece of writing will surely give you clarity on all the…

What is NavIC- India’s Homegrown GNSS System
Have you heard of NavIC – YES India’s very own GPS tracking system! This piece of writing is all about…

Your inbox awaits a welcome email. Stay tuned for the latest blog updates & expert insights.
"While you're here, dive into some more reads or grab quick bites from our social platforms!"Stay Updated on tech, telematics and mobility. Don't miss out on the latest in the industry.