Quick Summary
- RAG Reports utilize red, amber, and green indicators to assess driver behavior in fleet management, highlighting performance and compliance issues.
- These reports help fleet managers quickly identify high-risk drivers and vehicles, optimizing safety and operational efficiency.
- Real-time data from telematics and GPS tracking feeds into RAG Reports, enabling informed decision-making and timely interventions.
- Customizable metrics in RAG Reports allow businesses across various industries to focus on critical driver behavior and vehicle performance for enhanced fleet management.
Curious about RAG reports in fleet management? This piece explains how they help assess driver behavior through clear red, amber, and green indicators.
Every mile your fleet covers isn’t just about delivering goods. It’s a complex equation of risks, costs & responsibilities. Poor driving behavior doesn’t just compromise road safety- it also wastes fuel, drives up maintenance costs & increases the chances of compliance issues & liability claims.
That’s where modern driver behavior monitoring system step in. These tools track real-time data on speeding, harsh braking, idling & more. But here’s a catch turning all that data into actionable insight? That can be overwhelming.
This blog unfolds a solution to that data deluge: “RAG Reports”. We’ll explore what these reports mean and how they help fleet managers assess driver performance, manage risks, and improve efficiency.
So, without any further ado, let’s just start!
What are RAG Reports in the Fleet Management Industry?

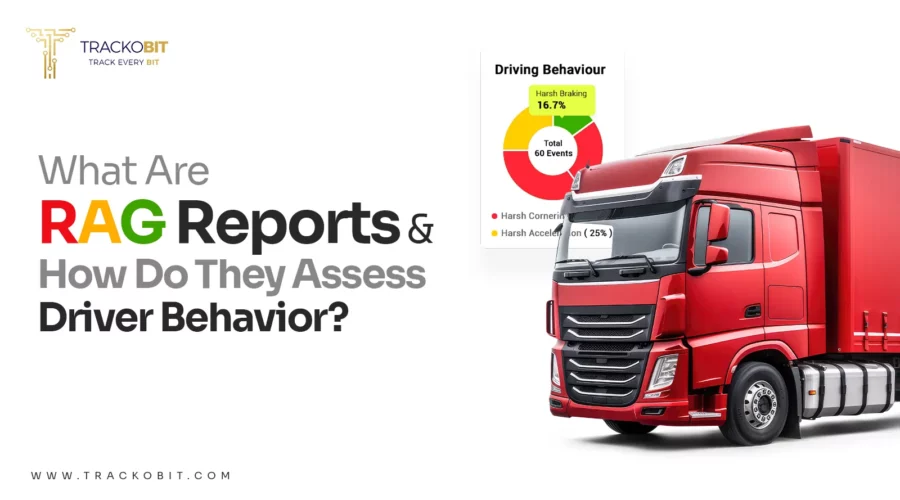
That’s how RAG reports are showcased
RAG Reports are a type of status that use Red, Amber & Green (RAG) color coding to quicky indicate the status of the fleet.
In simple words, RAG report is a visual reporting tool used in the fleet management industry. It helps track the health, performance & compliance of vehicles & drivers.
Fleet managers use RAG reports to quickly identify high- risk vehicles or drivers that need urgent attention. These reports help ensure compliance with service schedules, safety protocols, and regulatory standards. By highlighting issues early, RAG reports aid in optimizing fleet performance.
Overall, the reports provide you with a clear & quick overview. This further promotes timely & informed decision-making.
📌Note:You can always choose what metrics you want in your RAG report- it’s fully customizable to suit your specific fleet operations. For instance: if you’re in the construction business, you might choose to prioritize reports on vehicle maintenance, engine diagnostics & fuel usage. The reason behind this is heavy-duty machinery needs regular upkeep to avoid costly breakdowns. On the other hand, a petroleum industry business or the HAZMAT fleet may focus on driver behavior monitoring — tracking speeding, harsh braking, and route adherence to ensure safety and compliance. No matter the industry, RAG reports let you select the right fleet management KPIs that matter the most. Further helping you track what’s critical for your fleet & ignore the noise. |
The Mechanics – Where Does the Data Come From?
The mechanics of RAG reports is no such rocket science. It is all about smart data and processing. Here’s how RAG reports are generated in the fleet management process.
STEP 1- Data Collection from the Vehicles
Each fleet vehicle is equipped with telematics that gather essential data on vehicle health, usage, and more as:
- The Engine Diagnostics (like the fault codes, RPMs, engine load etc.)
- Fuel Metrics (covering consumption rates, refueling events etc.)
- Odometer Readings (providing insights into mileage, distance covered etc.)
- Vehicle’s Battery & Maintenace Status (insights into charge levels & service alerts)
This data is transmitted in real-time to comprehensive fleet management software via cellular or satellite network.
STEP 2 – Real-Time GPS Tracking
Each vehicle is equipped with GPS trackers. These trackers continuously feed live locational data into the systems. This includes the vehicle’s current position for real-time tracking, speed trends, trip history, idle time & any unauthorized stops.
Beyond just monitoring vehicle movement, this data plays a crucial role in assessing driver route discipline. This also helps in highlighting the instances of speeding, route deviations.
Additionally, min-to-min tracking of fleets helps fleet managers optimize both driver performance & route efficiency.
STEP 3 – Driver Behavior Monitoring
This is where the main element i.e. driver behavior truly takes center stage. Using onboard diagnostics (OBD) sensors & integrated driver apps, the system continuously monitors how vehicles are being operated.
It tracks events like harsh braking, rapid acceleration, speeding, aggressive cornering, and excessive idling.
Additionally, with the help of the driver app, the drivers can log driver duty hours, including log-in/log-out times, rest breaks, and fatigue levels.
These metrics directly influence vehicle health, fuel efficiency, and overall road safety. Further making them essential inputs for RAG evaluations.

STEP 4 – Data Aggregation in Fleet Management Software
All the data collected from vehicles, GPS trackers, and driver apps seamlessly flows into the fleet management software. Here, it is aggregated to create detailed driver and vehicle reports.
The fleet management software analyses this information using advanced algorithms that detect risky trends, inefficiencies, or anomalies.
Then the software benchmarks each data point against pre-set KPIs like safety standards, fuel economy, and maintenance schedules. This allows for precise and contextual insights.
STEP 5 – RAG Status Assignment
Once this analysis is done, the software assigns a RAG status to each driver or performance metric.
- Red highlights critical issues like repeated violations, unsafe driving habits, or performance falling below acceptable thresholds and demands immediate action.
- Amber serves as a caution flag for early signs of inefficiency or risky behavior, such as increased idling or occasional speeding.
- A Green status indicates safe, efficient driving with no concerns.
These color-coded statuses update in real-time, giving managers the ability to respond quickly with corrective measures, whether that’s retraining a driver or scheduling maintenance.
STEP 6 – Manual Inputs (Optional)
It will not be wrong to say that not all data can be captured automatically. For tasks like physical vehicle inspections, compliance audits, or logging incidents on the road, fleet managers can manually input data into the system.
These manual entries are integrated into the RAG evaluation, providing a completer and more balanced picture of both driver and vehicle performance. This step is completely optional.
STEP 7 – The Final Output: The RAG Report
The result is a streamlined, color- coded RAG report. The report highlights which drivers are displaying risky behaviors.
With these insights, you can pinpoint areas where safety training or corrective actions are needed. At the same time, you can identify drivers who are performing efficiently and staying within compliance standards.
Rag reports eliminate guesswork. Further helping you prioritize safety, ensure compliance, and drive optimal performance.
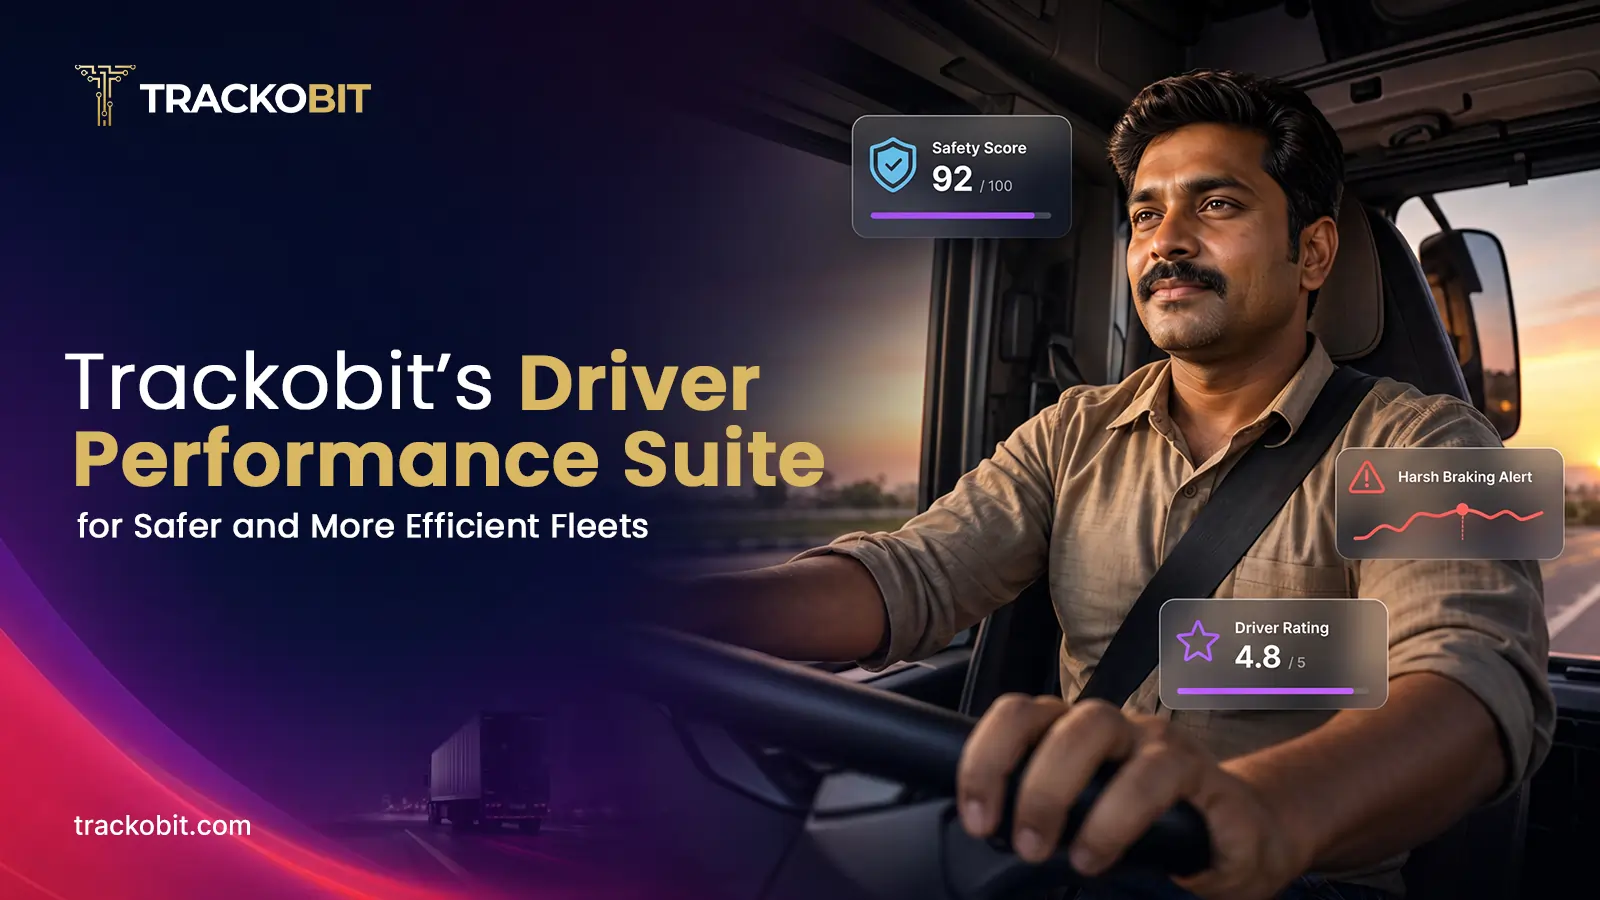
Key Driver Behavior Metrics in RAG Reports
It will never be wrong to say that understanding driver behavior goes far beyond tracking speed and idling. Advanced technologies like video telematics solutions take behavior monitoring to the next level. The core components of the video telematics software i.e. ADAS & DMS collect real-time, event-based data.
The events logged are not just informative, but they are one of the ways to calculate RAG score.
The Role of ADAS & DMS in RAG Scoring
Every time a critical event occurs—be it harsh braking, lane departure, or signs of driver fatigue—ADAS and DMS step in.
ADAS (Advanced Driver Assistance System) enhances road safety by detecting and preventing potential hazards through features like collision warnings and lane-keeping assistance. Whereas, DMS (Driver Monitoring System) focuses on driver behavior, identifying signs of fatigue, distraction, or drowsiness to ensure alert driving.
Dashcams capture these incidents in real-time and transmit the data to the fleet management software.
The system then analyzes each event, assigns a severity-based score, and quantifies it accordingly.
These weighted events collectively determine a driver’s RAG (Red-Amber-Green) score over a set period—daily, weekly, or monthly—providing a comprehensive assessment of driving performance.
Let’s say – A minor speeding event might add a small score whereas a forward collision warning or fatigue alert may add a higher score due to increased risk.
Now as the score accumulates, the system automatically categorizes the driver’s status according to the Red Amber Green (RAG) parameter.
Well, if you’re looking to monitor drivers, assess risks, and enhance safety in real-time, TrackoBit’s Video Telematics System can help. Capture critical events, assign weighted scores, and categorize drivers with RAG reports for smarter, data-driven decisions.
Why Does RAG Score Matter?

That’s how RAG scores are indicated!
Rag scores are more than just red, amber and green labels. They are data- driven risk indicators that help fleet managers make informed decisions before issues escalate.
Here’s a list of reasons justifying why they are essential –
1. Risk Management
Rag score highlights at-risk drivers & vehicles in real-time. This allows you to act before small issues turn into costly accidents & breakdowns.
2. Target Coaching & Cost Reduction
This score helps you identify specific driving patterns (e.g. frequent speeding or harsh braking). With the help of this you can differentiate between a good driver & a bad one. Once you know how they perform, you can implement training & coaching programs for them.
Remember better the driving patterns, lower the wear and tear, and lighter the fuel and liability costs.
3. Performance Benchmarking
Over time, Rag score helps benchmark driver performance & set clear KPIs. With transparent data-backed evaluations your team stays motivated to improve & you can make fair, informed decisions around rewards, training or corrective action. And work towards making more robust and effective fleet management strategies.
What’s the Right Tolerance Range for My RAG Status?
Clearly, there’s no one precise range that fits all businesses. Your Rag tolerance ranges should align with your industry, fleet type and operational priorities.
The “right” thresholds for when a metric turns from green to amber or red depend entirely on what’s critical for your business.
From an industry standpoint, here’s how to determine the right thresholds
-
Construction or Heavy Equipment Fleets
You might set tighter limits on maintenance schedules and engine health, since downtime means stalled projects and high repair costs. Even a slight delay in service could trigger an amber or red status.
Have a look at- What are the Benefits of Construction Fleet Management Software?
-
Logistics or Last-Mile Delivery Fleets
Here, route adherence and fuel efficiency may take priority. You could set strict thresholds on fuel consumption or idling time.
-
Petroleum or Hazardous Goods Transport
Safety is important. Very low tolerance for harsh braking, speeding, or fatigue might be needed — even a small violation may push a driver’s status to red, given the high risk.
Final Words
It will not be wrong to say that Rag reports simplify driver performance evaluation with clear red, amber and green indicators. When backed with telemetry data, the solution helps you identify risky behaviors, ensure timely interventions & enhance the overall fleet safety.
Moreover, their adaptability across industries and scalability for businesses of all sizes make RAG reporting a valuable tool for improving fleet safety.
FAQs
-
How do Rag reports improve driver safety?
Rag reports flag risky behavior in real time. This helps fleet managers take timely corrective action for safer driving.
-
How do telematics solutions contribute to Rag reporting?
Telematics captures real-time driving data. This data is further analyzed to assign accurate RAG scores for driver safety insights.
-
Can small businesses benefit from Rag reporting?
Yes, small to large, any business can use Rag reports to monitor drivers cost-effectively and reduce accidents & maintenance costs.

Anvesha is a communication specialist at TrackoBit. With a strong background in media and communications, she adds much-needed balance and brevity to TrackoBit’s... Read More
Related Blog
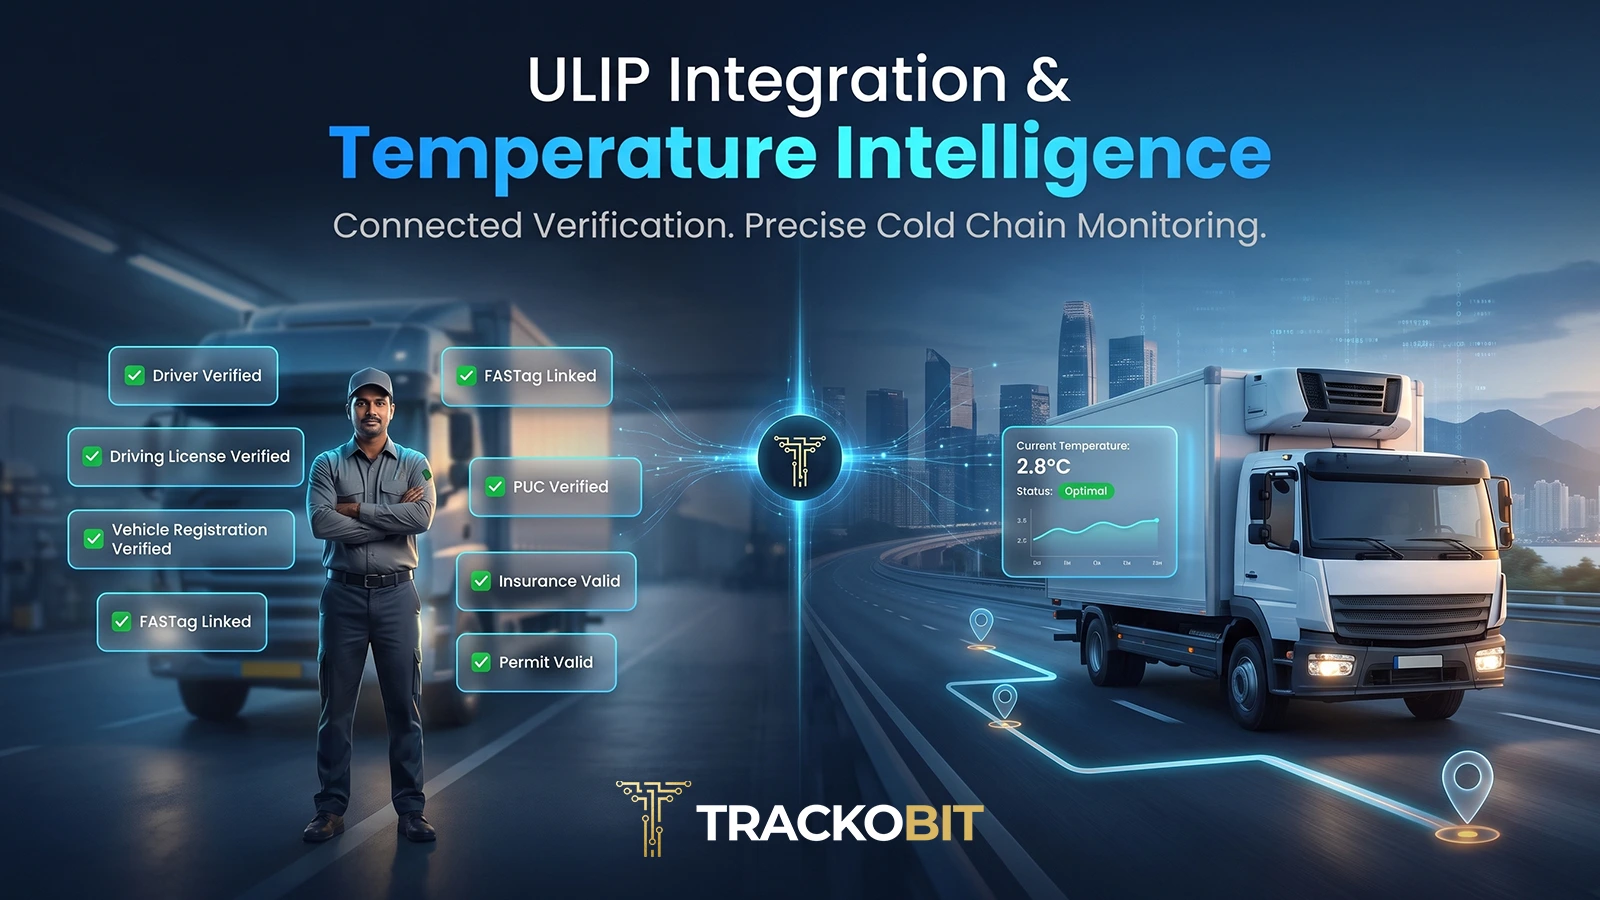
ULIP Integration & Temperature Vs Distance: Now Live in TrackoBit
Simplify fleet verification and cold chain monitoring with TrackoBit’s latest release. Align driver and vehicle records with national logistics infrastructure,…
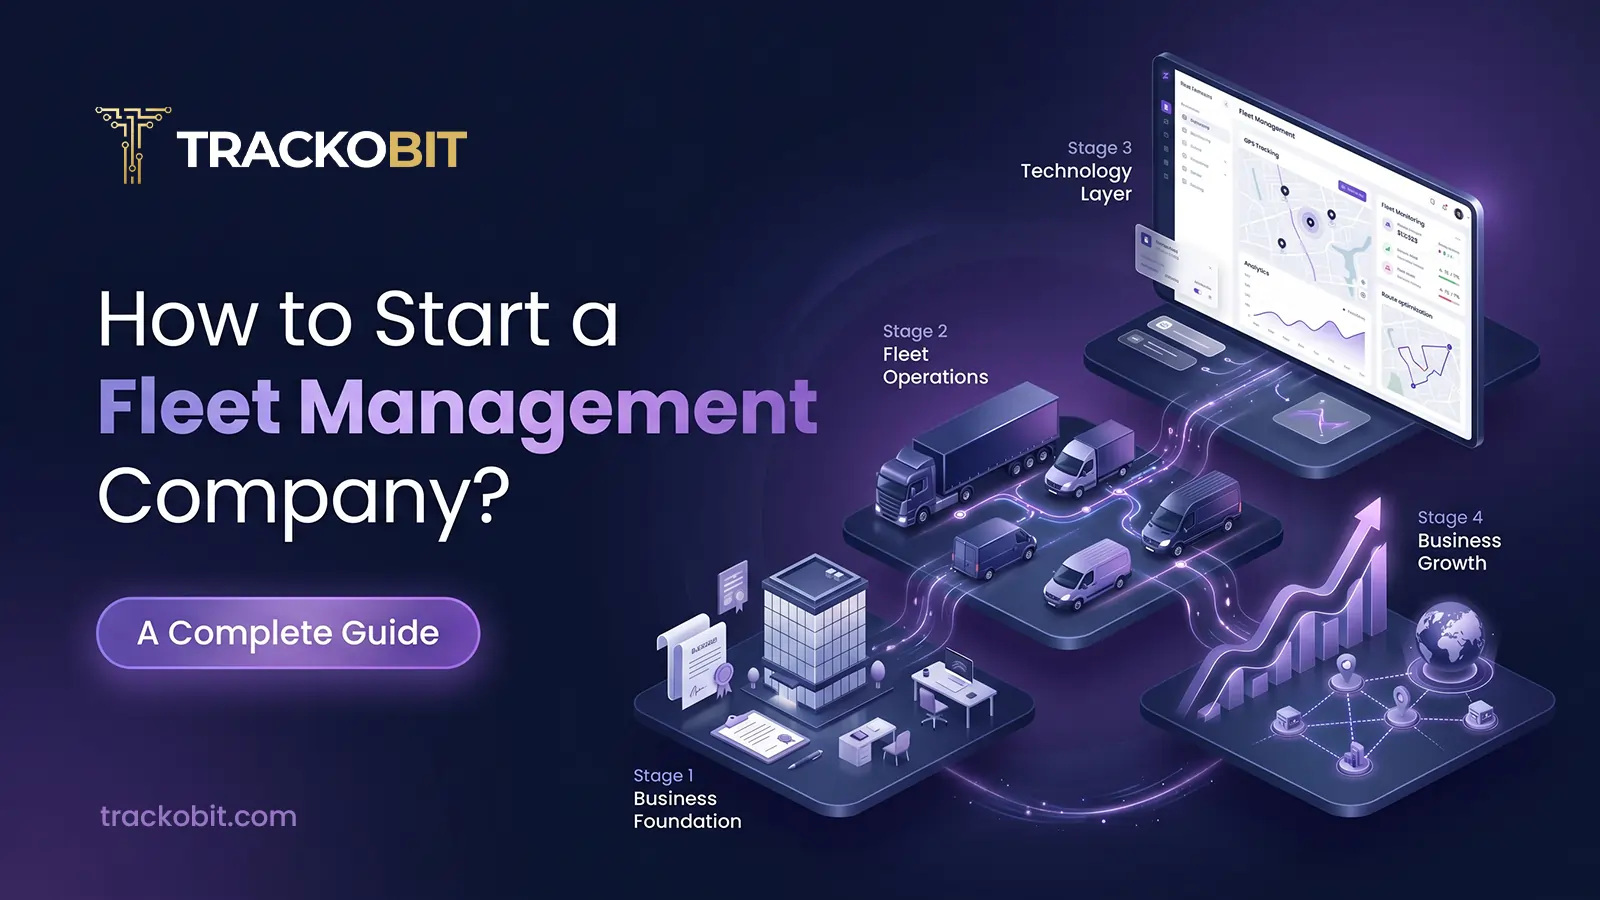
How to Start a Fleet Management Company: Step-by-Step Guide
Wondering how to start a fleet management company? You’re at the right space. We have covered 10 simple steps to…

Indian Companies Don’t Refuse to Pay for Software. They Refuse to Be Burned Twice.
Indian companies are not slow to buy software because of price. They are slow because they have been burned before,…
How TrackoBit Turns Driver Data into Better Fleet Performance
Discover how driver scorecards, RAG, BRAG, and performance reports help fleets reduce risks. And how TrackoBit’s driver performance suite improve…

Your inbox awaits a welcome email. Stay tuned for the latest blog updates & expert insights.
"While you're here, dive into some more reads or grab quick bites from our social platforms!"Stay Updated on tech, telematics and mobility. Don't miss out on the latest in the industry.