Quick Summary
- In 2026, the last mile delivery market is projected to grow from $167.36 billion to $348.85 billion, driven by eCommerce and customer demand for faster deliveries.
- Last mile delivery accounts for 53% of shipping costs, with major cost drivers including fuel, driver wages, and failed deliveries.
- Customer expectations are rising, with over 90% preferring free shipping and demanding live tracking and flexible options.
- Technology, including AI and electric vehicles, is transforming last mile delivery, improving efficiency and sustainability in response to consumer preferences.
Explore the key last mile delivery statistics, trends, and insights every logistics business needs to stay competitive in 2026.
In 2026, rising customer demands, increasing urban traffic, and volatile fuel prices have changed last mile delivery operations.
Businesses are heavily investing in automated last mile delivery platforms with AI and route planning features. Electric vehicles and drones are becoming go-to mediums for last mile delivery. The reason behind these emerging trends and technologies is that last mile delivery, often being the shortest part of a supply chain, is the most critical. It’s a major factor in customer experience, business growth, and operational costs.
On that note, we bring you this comprehensive blog about the important last mile delivery statistics and latest trends shaping the industry in 2026. Read on!
Last Mile Delivery Market Size & Growth Statistics
The global last mile delivery market is growing at a rapid pace. The factors to credit include:
- Fast eCommerce growth
- Demand for doorstep delivery
- Expansion of quick commerce
- Rise of same-day delivery services
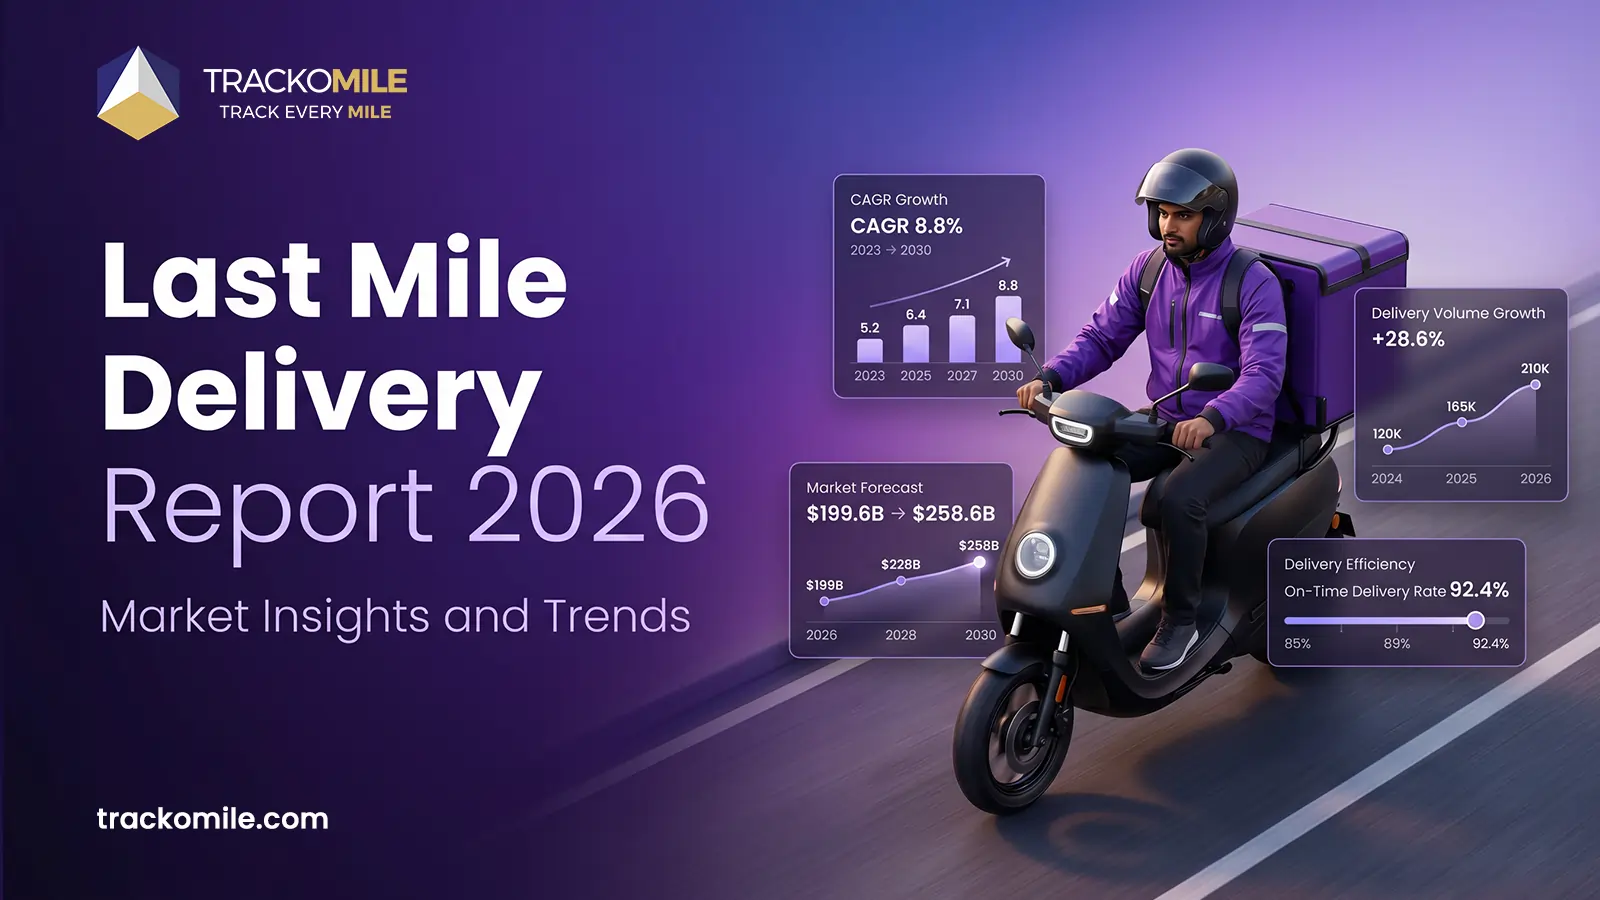
The global last mile delivery market was valued at $167.36 billion in 2025. It is expected to reach $348.85 billion by 2033, growing at a whopping CAGR of 9.8%.
Amazon alone delivered more than 13 billion same-day and next-day items globally in 2025. The market is also seeing strong growth in:
- Hyperlocal delivery
- B2B product delivery
- Grocery delivery
- Healthcare delivery
- Construction logistics
As customer expectations rise, businesses are investing more in delivery networks and automation.
Here are some more key last mile delivery statistics any business manager with logistics team should look at.
1. Last Mile Delivery Cost Statistics
Last mile delivery remains the most expensive part of a logistics supply chain. As per Statista, last mile delivery now accounts for 53% of total shipping costs. This share was 41% in 2018.
Several industry studies also conclude that last mile delivery represents around 40% to 55% of total last mile logistics costs. The biggest cost drivers include:
- Fuel expenses
- Driver wages
- Failed deliveries
- Traffic delays
- Reverse logistics
- Vehicle maintenance
Failed deliveries can cost businesses ₹180–₹400 in combined logistics spend. Last-mile delivery platforms also list labour, fuel usage, warehouse operations, and returns as major sources of delivery costs.
These last-mile delivery statistics reveal why businesses today are heavily focusing solutions like route optimisation and delivery automation. Even small improvements can lead to huge cost savings in the long run.
2. Failed Last Mile Delivery Statistics
Failed deliveries remain a major headache in logistics. Every failed delivery increases operational costs and reduces customer satisfaction..
Common reasons for failed deliveries include:
- Wrong addresses
- Customer absence
- Poor route planning
- Delivery delays
- Rider errors
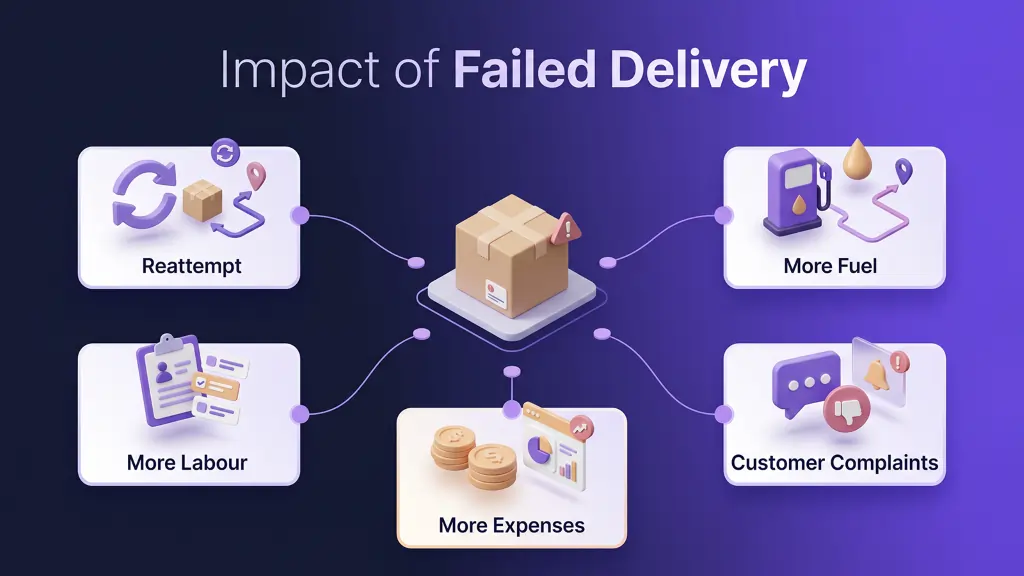
Impact of Failed Last Mile Delivery
Failed deliveries create additional costs because companies must:
- Reattempt delivery
- Handle customer support requests
- Manage reverse logistics
- Use more fuel
- Spend more driver hours
The problem affects businesses the most during peak demand periods when labour shortage is already low and consumer demand is all time high.
High failed delivery rates also damage customer trust. Businesses now use live tracking, delivery alerts, proof of delivery, and route optimisation tools to reduce delivery failures.
3. Customer Expectations & Behaviour Statistics
Customer expectations continue to shape the future of last-mile delivery. People want faster deliveries and more transparency but not higher shipping costs. This has become quite a puzzle for businesses. According to McKinsey:
- More than 95% of consumers prefer free shipping over paid shipping.
- Nearly 90% of consumers are willing to wait up to three days for delivery.
- More than 90% of shoppers may abandon purchases because of high shipping costs.
Delivery visibility is also important for consumers. According to Bringg:
- More than 70% of consumers think about delivery before checkout.
- 61% of shoppers may leave their carts if live delivery tracking is unavailable.
- 51% may abandon purchases if there is no clear delivery time window.
Customers also expect:
- Live tracking
- Delivery alerts
- Accurate delivery times
- Flexible delivery options
- Low shipping costs
Businesses that fail to meet these expectations risk losing customers to their competition.
4. Last Mile Delivery Technology & AI Statistics
Technology has transformed the landscape of last-mile delivery. AI, automation, predictive analytics, and smart routing systems are helping businesses improve delivery speed and driver efficiency.
As per Business Insider, last mile delivery accounts for around 41% of logistics costs. This is pushing companies to invest heavily in AI solutions. Companies now use AI for:
- Route optimisation
- Delivery forecasting
- Traffic prediction
- Driver allocation
- Rider risk detection
- Rider roster planning
Large companies like Amazon, Dispatch, and Veho already use AI-driven delivery systems to improve performance. AI helps businesses:
- Reduce delays
- Lower costs
- Improve customer experience
5. Sustainability & EV Delivery Statistics
Sustainability has become a major focus area for logistics businesses. Many are adopting electric vehicles (EVs) for last-mile delivery. Around 60% of consumers choose delivery services based on sustainability practices.
The customer demand for green delivery options is also growing to. A survey found that 28% of consumers are willing to pay more for sustainable delivery options.
Fuel costs are also driving EV adoption. The Economic Times reports that companies are rapidly expanding their EV fleets because of fuel price volatility and rising operational costs.
Benefits of EV adoption include:
- Lower fuel costs
- Lower emissions
- Shorter training curve
- Better sustainability goals
- Reduced maintenance costs
- Improved long-term savings
With governments also subsidising and pushing for greener transport, EV adoption in last mile delivery will continue to increase.
Read Blog – Sustainable Last Mile Delivery Solutions
What Are The Major Last Mile Delivery Challenges in 2026?
Despite a growing market, last mile delivery is still plagued with challenges like high operational costs, increasing traffic and changing delivery expectations.
1. Rising Costs
Fuel prices, labour expenses, and vehicle costs continue to rise. Global turbulence and inflation can greatly affect last-mile delivery costs.
2. Delivery Speed
Nowadays, most customers want same-day or next-day delivery. Meeting these demands is expensive. Plus, the extra costs cannot be billed to the customers. Businesses must find ways to deliver faster while optimising shipping costs.
3. Traffic Congestion
Urban traffic remains a major challenge in last-mile delivery. Traffic delays increase delivery times and fuel consumption. Frequent ignition stop-start also takes a toll on the vehicle in the long term.
4. Rider Shortages
Many regions continue to face rider shortages due to low density or local transport regulations. This affects delivery capacity and operational efficiency.
5. Sustainability Pressure
Since governments are pushing for eco-friendly deliveries, businesses must balance speed, cost, and sustainability goals. This creates operational complexity and can be expensive too.
6. Fragmented Delivery Networks
Recent research shows that last mile networks remain highly fragmented and difficult to optimise. Businesses must improve planning and visibility to overcome these challenges.
Master Statistics Reference Table
|
Metric |
Statistic |
|
Global last mile market size (2025) |
$167.36 billion (Grand View Research) |
|
Projected market size by 2033 |
$348.85 billion (Grand View Research) |
|
Last Mile Delivery Market CAGR |
9.8% (Grand View Research) |
|
Share of shipping costs |
53% (Statista) |
|
Logistics cost share |
40–55% (Statista) |
|
Failed delivery cost |
Up to $20 per order (Amazon Shipping) |
|
Consumers preferring free shipping |
95%+ (McKinsey & Company) |
|
Consumers willing to wait 3 days |
Nearly 90% (McKinsey & Company) |
|
Consumers choosing sustainable delivery |
|
|
Consumers willing to pay more for green delivery |
28% (YouGov) |
How TrackoMile Can Improve Last Mile Delivery Performance
The last mile delivery market is evolving constantly as evident by the last mile delivery statistics mentioned in this blog. This has made the use of automated delivery management software essential. Businesses across various industries are adopting software like TrackoMile.
It provides complete visibility and control of last mile operations. Managers can plan routes, assign tasks and track riders in a single platform. The TrackoMile mobile app lets riders deliver faster, collect ePOD, and work with more efficiency on the ground.
The result? Higher delivery success rates and lower delivery costs. As last mile delivery continues to grow in scale and complexity, companies that invest in smarter delivery systems are set to gain a strong competitive advantage. So, be sure to check out TrackoMile today.

Frequently Asked Questions
What percentage of shipping costs is last mile delivery?
Last mile delivery accounts for about 53% of total shipping costs. It is often the most expensive part of the delivery process. The reason being high fuel prices, labour costs, and traffic delays. These lead to failed or repeat deliveries and slow down operations.
What is the size of the last mile delivery market in 2026?
The global last mile delivery market is on track to exceed $200 billion in 2026. This is per the latest last mile delivery statistics. This fast growth is mainly due to the rise of eCommerce, grocery delivery, and quick commerce. AI-powered delivery management platforms that make last mile deliveries smooth and cost-effective, making them more preferred by consumers.
What do customers expect from delivery in 2026?
Last mile delivery statistics show that customers continue to ask for quick, door-step delivery, free shipping, and live tracking. They also want clear delivery times and regular updates. Many consumers cancel their orders if delivery costs are too high.
What is the average cost of a failed last mile delivery?
A failed last mile delivery costs businesses between $18-$20 per order on average. Every failed delivery results in more fuel usage and more operational expenses. Riders' time is also wasted, and their efficiency suffers.
How is AI changing last mile delivery?
AI helps businesses plan better routes, predict delays, and improve delivery speed. It can reduce travel time and improve resource use. AI also helps delivery managers make faster decisions. This leads to lower costs and sustainable growth.
How do you reduce last mile delivery costs?
Businesses can reduce last mile delivery costs through route planning, live rider tracking and smart delivery planning. Using last mile delivery management software helps improve efficiency, reduce fuel use, lower labour costs, and increase delivery success rates.

Mudit is a seasoned content specialist working for TrackoField. He is an expert in crafting technical, high-impact content for Field force manage... Read More

Related Blog
Last Mile Visibility: How Real-Time Tracking Improves Delivery Experience?
This blog explains how last mile visibility improves delivery tracking and route efficiency. Plus, we will look at how it…
How to Start a Last Mile Delivery Business in 2026?
Wondering how to start a last mile delivery business? You are at the right space. We have covered 6 simple…
Last Mile Delivery: Market Size, Share & Trends Report 2026
A comprehensive overview of market size, growth trends, and the future outlook. Dive deeper into last mile delivery market.
How Long Does Last Mile Delivery Take? Time, Factors & Solutions
This guide covers how long does last mile delivery take, the factors that affect it, and practical solutions to keep…

Your inbox awaits a welcome email. Stay tuned for the latest blog updates & expert insights.
"While you're here, dive into some more reads or grab quick bites from our social platforms!"Stay Updated on tech, telematics and mobility. Don't miss out on the latest in the industry.