
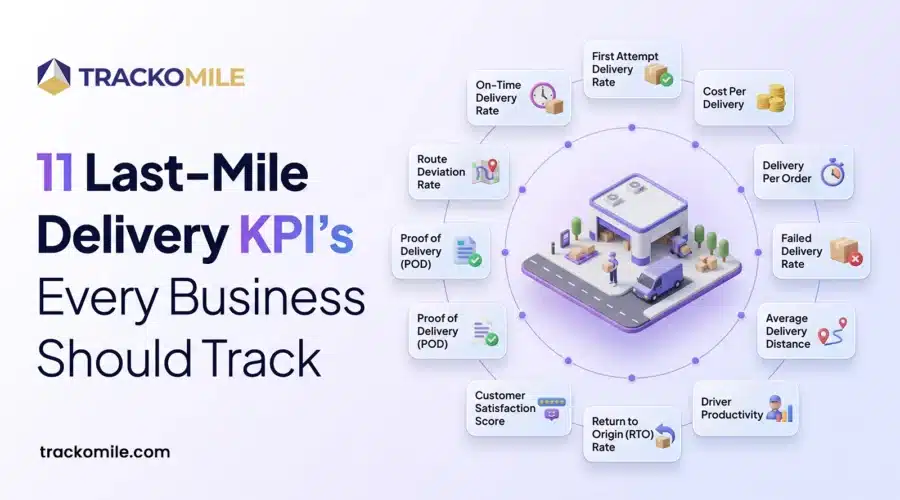
To improve last mile operations, it’s important to track 11 essential last mile delivery KPIs like on-time delivery rate, cost per delivery, failed delivery rate, and more.
Last mile delivery is where the product reaches the customers from the warehouse. That’s why most logistics and delivery companies spend significant resources and efforts to ensure accurate last mile operations. Any delays, failed delivery attempts, complaints can affect profitability.
Last mile delivery can make or break your brand’s image in the customers’ eyes. So, optimising the operations is essential if you wish to grow your business sustainably, gain customer trust, and gain a competitive edge.
The first step in this process involves setting clear targets and tracking the right last mile delivery KPIs. These metrics help businesses measure performance, identify weak areas, reduce costs, and improve customer satisfaction.
In this blog, we will explain what last mile delivery KPIs are, why they matter, and what are the 11 most important metrics to track in 2026.
What Are Last Mile Delivery KPIs & Why Are They Critical in 2026?
KPI stands for Key Performance Indicator. These are quantifiable metrics used to measure an organisation’s, team’s, or individual’s progress toward achieving a specific goal.
The difference between a metric and KPI is that the latter depends on what the company cares about most. If the goal is faster delivery, delivery time becomes a KPI. If the goal is reducing costs, fuel cost becomes a KPI.
By tracking KPIs, managers can know:
- Are deliveries reaching customers on time?
- How many deliveries fail on the first attempt?
- How much does each delivery cost?
- How productive are delivery agents?
- Are customers satisfied with the delivery?
These KPIs and metrics help last mile managers understand what’s working and what needs improvement. Without KPIs, businesses often don’t realise there is a problem until it’s too late to fix it. Tracking KPIs regularly and smartly helps businesses move from reactive management to proactive decision-making.
Businesses that track KPIs grow faster because they improve faster. Those that ignore metrics continue to repeat the same mistakes. When businesses monitor the right delivery metrics, they can:
- Quickly identify delays
- Reduce repeated delivery attempts
- Improve driver productivity
Good delivery performance is a major business advantage and that’s what makes tracking KPIs critical in 2026.
Common Challenges in Tracking Last-Mile KPIs
Lack of real-time visibility, disconnected operations, and no proof of delivery are the major challenges in tracking last-mile KPIs.
1. Poor Real-Time Visibility
Many businesses still rely on manual reporting, calls, texts, and EOD updates to track deliveries. This method is quite prone to delays and errors. Making quick decisions become difficult, if managers cannot see what is happening during the day.
2. Disconnected Systems
Delivery teams, warehouse staff, and customer service often use different tools that do not connect properly. This creates incomplete records and gaps in reporting. Due to this, managers struggle to make sense of data and make decisions based on outdated information.
3. Lack of Proof of Delivery
Without proper proof of delivery, businesses cannot confirm whether orders were delivered correctly. This affects the audit trail and creates customer disputes. Geo-tagged photos, OTP verification, and digital signatures help verify successful deliveries.
4. Poor Route Planning
Bad route planning increases delivery time, fuel costs, and driver stress. It’s one of the biggest challenges that affects last mile KPIs, cuts into your profits and affects customer service.
5. Weak Customer Communication
Many failed deliveries happen because customers are not informed properly. Frustration arises due to:
- No delivery alerts
- Unclear ETAs
- Sudden rescheduling
- Rider no shows
Strong customer communication improves first-attempt delivery success and helps reduce return-to-origin (RTO) rates.
6. Tracking Too Many Numbers
Some businesses try to track every possible KPI. This can be counter productive. Instead, businesses should focus on what matters the most. Too much data creates confusion instead of clarity. The goal is not to measure everything, but to track KPIs relevant to your business and help improve delivery performance.
11 Essential Last Mile Delivery KPIs & Metrics
To ensure success in the last mile delivery stage, businesses need to focus on KPIs that affect delivery time, rider productivity, customer satisfaction, and operational costs. Here are the 11 most important last mile delivery KPIs to track.
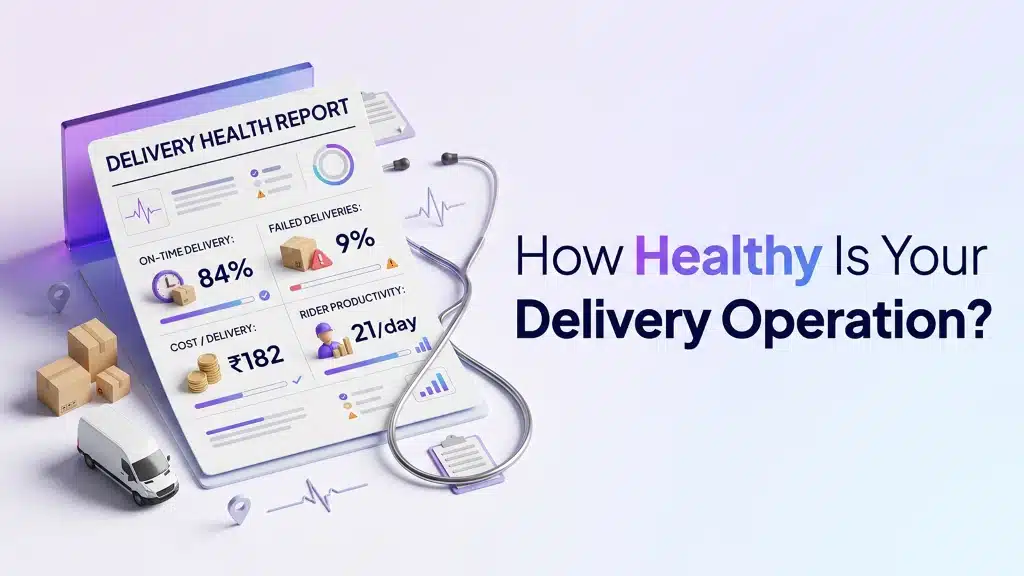
Essential KPIs to Track To Ensure Smooth Delivery Operations
1. On-Time Delivery Rate
On-time delivery rate (OTDR) shows how many deliveries reach customers within the promised delivery window. It’s one of the most important last mile delivery KPIs. A low OTDR means customers are waiting too long and service quality is not good.
Formula: OTDR = (On-time deliveries ÷ Total deliveries) × 100
2. First Attempt Delivery Rate
FADR measures how many deliveries are completed successfully on the first attempt itself. Repeated delivery attempts increase fuel costs, reduce rider efficiency and increase resource wastage.
Formula: FADR = Successful first attempt deliveries ÷ Total delivery attempts
3. Cost Per Delivery
Cost per delivery (CPD) shows how much money is spent to complete a single delivery. The cost includes:
- Fuel
- Labour
- Vehicle costs
- Accommodation
Lower CPD means more profitability and better operational efficiency.
Formula: CPD = Total delivery cost ÷ Total deliveries
4. Delivery Time Per Order (DTPO)
Delivery time per order tracks how much time is spent on a delivery – from dispatch to the customer doorstep. DTPO helps identify delays and route inefficiencies.
5. Failed Delivery Rate
This measures how many deliveries fail due to wrong addresses, unavailable customers, or delivery issues. High delivery failure rate leads to extra costs and negatively affects customer experience.
Formula: Failed delivery rate = Failed deliveries ÷ Total deliveries × 100
6. Average Delivery Distance
This shows how far delivery agents travel per order. Longer routes often increase fuel costs, delivery time and resource utilisation. Lowering the average delivery distance helps optimise your budget and increase staff productivity.
7. Driver Productivity
This tracks how many deliveries each driver completes in a day. It helps businesses understand workforce efficiency and workload balance.
Formula: Driver productivity = Total deliveries completed ÷ Number of drivers
8. Return to Origin (RTO) Rate
RTO rate measures how many orders return to the warehouse or central hub after a failed delivery. High RTO rates increase logistics costs and reduce profits. Lower RTO means better control on your delivery operations.
Formula: RTO rate = Returned orders ÷ Total orders × 100
9. Customer Satisfaction Score
A fast delivery with the wrong order is just has bad as a slow delivery with the right order. In the end, the success of your last mile operations comes down to customer satisfaction. The only way this can be done is by collecting feedback from the customers after delivery. It can reveal if orders are reaching customers on time and riders are behaving appropriately.
10. Proof of Delivery (POD)
Digital POD means whether delivery agents upload proper proof of work after a completed delivery. This can include order photo, customer signature, or any documents. OTP verification and geotagged information also serve as viable POD in last mile operations. POD helps maintain a trail of work for compliance and reduce disputes.
11. Route Deviation Rate
This tracks how often drivers move away from planned delivery routes and take unplanned routes. Frequent route deviations may indicate poor planning, rider indiscipline or misuse of time.
How to Improve Last Mile KPIs?
Route optimisation, enhancing customer communication, and collection of proof of delivery are the best methods to improve last-mile KPIs.
1. Improve Route Optimisation & Rider Management
Smarter route planning helps reduce travel time, fuel costs, and delivery delays. Riders can complete more deliveries in less time when routes are properly planned. Better routes improve on-time delivery rates and increase overall delivery team productivity.
Last-mile delivery software like TrackoMile analyses over 120 factors to assign the best possible routes. It can also manage rider roster and assign orders based on proximity, skills, and distance.
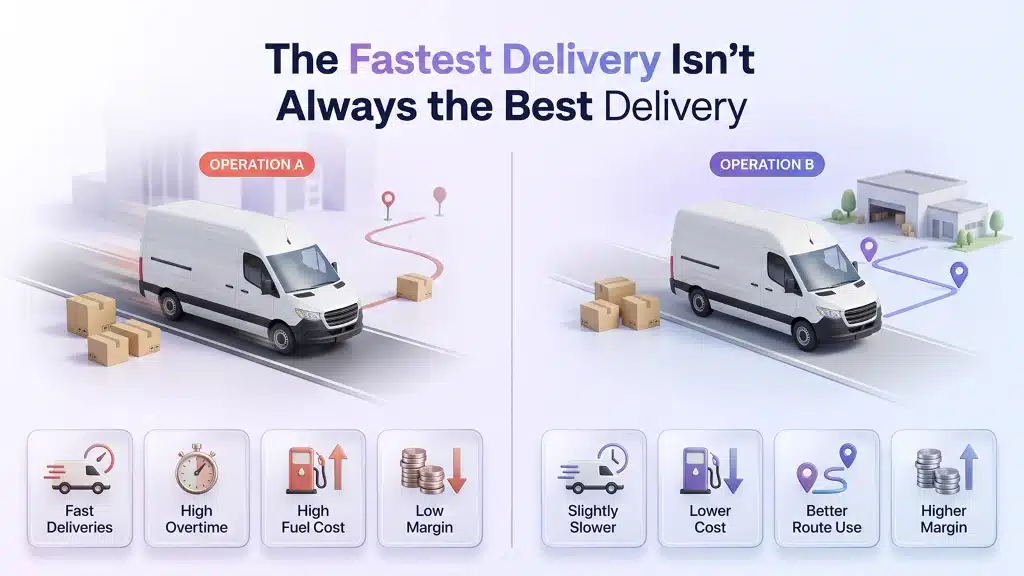
Ensure fast yest cost-effective deliveries with route optimisation
2. Enhance Customer Communication
Unhappy customers can be detrimental to the success of your last mile operations. To prevent this, businesses must ensure customers receive:
- Accurate ETAs
- Tracking links
- Timely delivery alerts
- Rider details
Customers should have the option to reschedule time slots. This reduces missed deliveries and improves first-attempt success rates. Clear communication also fosters trust and leads to a smoother delivery experience for customers.
3. Make Proof of Delivery Mandatory
Every delivery should include proper proof such as:
- OTP verification
- Geo-tagged photos
- Digital signatures
- Documents & bar codes
This improves accountability, helps managers verify field activity and reduces delivery disputes. Using TrackoMile, managers can mandate the upload of documents, pictures or customer signatures. The software also provides happiness code (OTP) at the time of delivery for added accuracy.
4. Monitor Rider Performance Regularly
Managers should review delivery reports often to understand rider productivity and identify weak areas early. Monitoring should focus on improvement, not just supervision. Supporting riders with better planning and feedback leads to stronger long-term delivery efficiency. With TrackoMile, managers can get detailed reports on:
- Delivery completion rates
- Driver productivity
- Failed deliveries
- Rider productivity
5. Automate Delivery Tracking
Manual tracking leads to:
- Delayed data analysis
- Incomplete records
- Audit discrepancies
- Poor decision making
Real-time delivery tracking systems provide faster updates and more accurate reporting. Automation improves visibility for managers and helps managers resolve problems quickly.
6. Review KPIs Consistently
KPIs are not a one-and-done thing. Businesses need to regularly track KPIs to:
- Spot patterns
- Fix hidden issues
- Reward staff performance
Continuous monitoring helps teams stay focused on results and ensures delivery operations keep improving.
Conclusion
Every business has to keep an eye on KPIs. There’s just no way around it. Otherwise, issues slip through the cracks. You get late or missing deliveries, unhappy customers, and your costs go through the roof. Basically, if you’re not measuring something, good luck trying to fix it.
But the thing is it’s not about drowning in data. You need to pick the metrics that actually matter for your business. For last mile delivery, focus on the numbers that count: on-time delivery rate, first-attempt delivery success (FADR), return to origin (RTO), and cost per delivery.
Tracking these KPIs keeps your costs in check, helps your team work better, and gives your customers reasons to trust you. When you stay on top of them, your whole operation gets smoother, you grow faster, and you don’t get left behind.
Looking to keep your business on track for 2026? Look for delivery management software that makes last-mile tracking smarter, like TrackoMile.

Frequently Asked Questions
-
What are the most important last mile delivery KPIs?
The major KPIs are on-time delivery rate, first-attempt delivery success, and cost per delivery. Don’t forget to track rider productivity, failed deliveries, and how satisfied your customers are. These numbers help you spot problems, deliver better, and keep spending in check.
-
What is a good first attempt delivery rate (FADR)?
90% or above is a good first attempt delivery rate to have. This means most of your last-mile deliveries are completed on the first try. No failures, no delays, and no reattempt required. Good FADR helps reduce fuel costs, save rider time and improve customer experience.
-
How to Build a Last Mile KPI Dashboard?
Your dashboard depends on the type of business you have – service or product. To build a smart dashboard, choose relevant KPIs for your business. These can include on-time delivery/service, FADR, cost per delivery, fuel usage, and distance travelled. Ensure all the data is updated in real time and use the best last mile delivery software like TrackoMile. The dashboard should also be easy to navigate and customisable.
-
How to measure last mile delivery performance?
You can measure last mile delivery performance by tracking the time, accuracy, and cost of your deliveries. Customer feedback and proof of delivery are also important to collect. These numbers show how smoothly your last-mile operations are running.
-
What is the difference between a KPI and a metric in last mile delivery?
A metric is any number you track. A KPI is a metric that directly measures an important business goal. Completed deliveries, distance covered or travel time are metrics. On-time delivery rate, cost per delivery and travel time per order are KPIs. Remember, all KPIs are metrics, but not all metrics are KPIs.
-
How Does TrackoMile Track & Improve Every Last Mile KPI?
TrackoMile provides real-time rider tracking, smarter route planning, proof of delivery, and detailed reporting from one platform. It allows managers to monitor and optimise delivery progress, stoppages, and route deviations. This improves faster decision-making and stronger operational control.

Mudit is a seasoned content specialist working for TrackoField. He is an expert in crafting technical, high-impact content for Field force management software With years of experience rooted in the me... Read More


Related Blog
Building Resilient Delivery Operations with TrackoMile in 2026 and Beyond
Logistics businesses build resilient delivery networks with TrackoMile. But how exactly? With real-time route optimization, automated scheduling, and end-to-end fleet…
How to Scale Quick Commerce Beyond 10 Minutes with TrackoMile
TrackoMile transforms chaotic last-mile logistics into a predictable, automated, and high-margin retail powerhouse. See how it works in quick commerce.
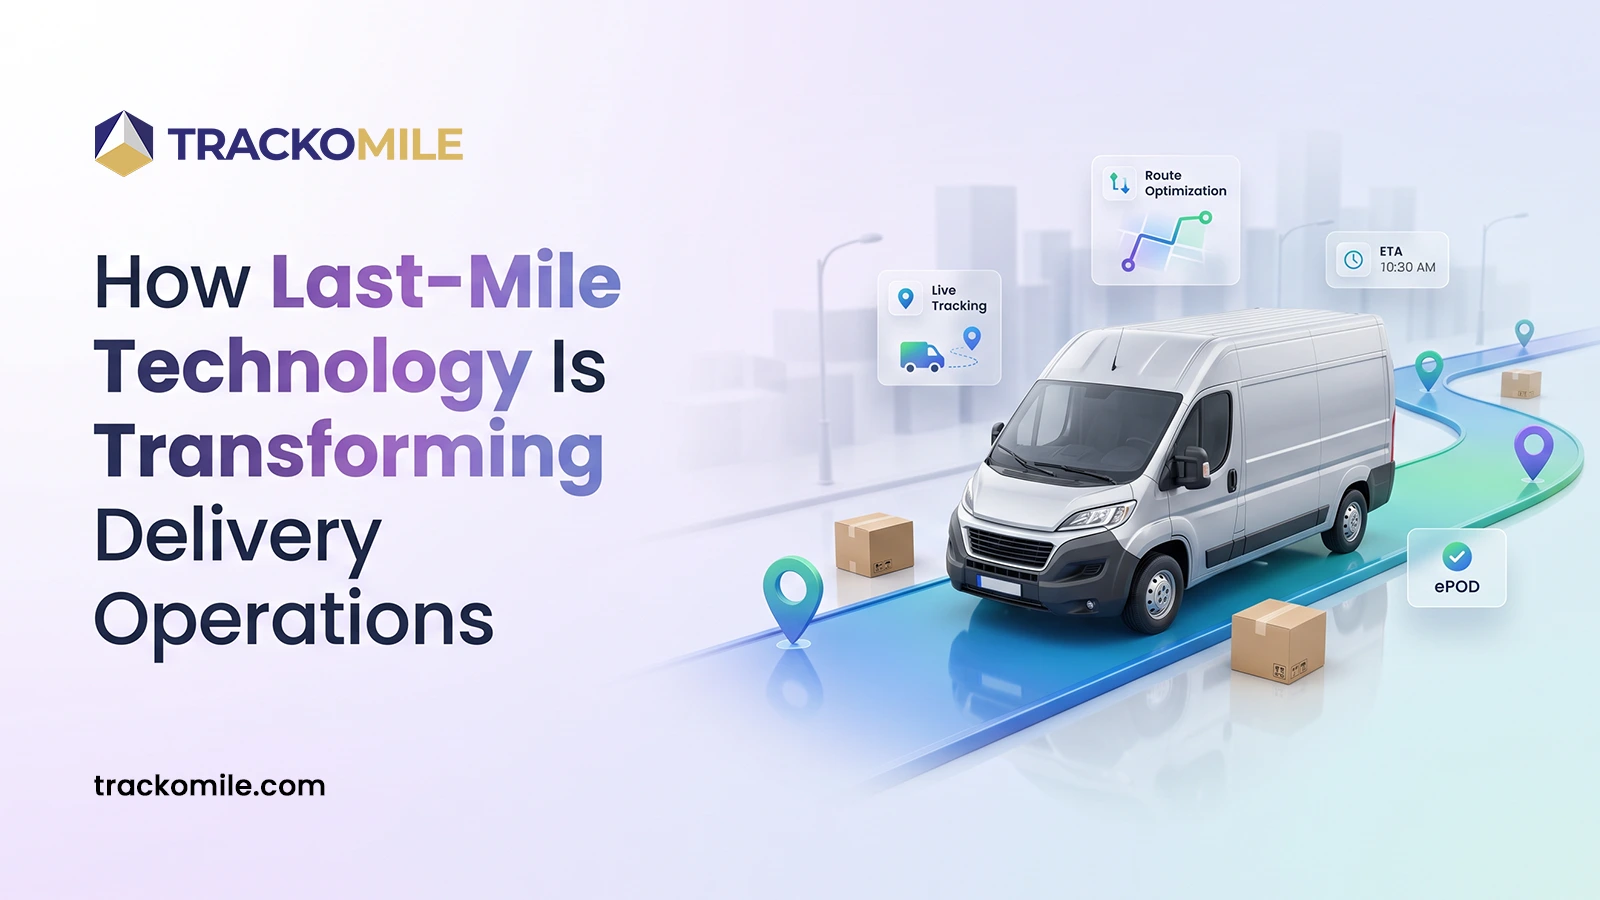
Last-Mile Technology: 6 Technologies Transforming Delivery Operations
Learn how last-mile technology combines routing, dispatch, tracking, ePOD, and analytics. Improve your businesses’ delivery speed, visibility, efficiency, and customer…
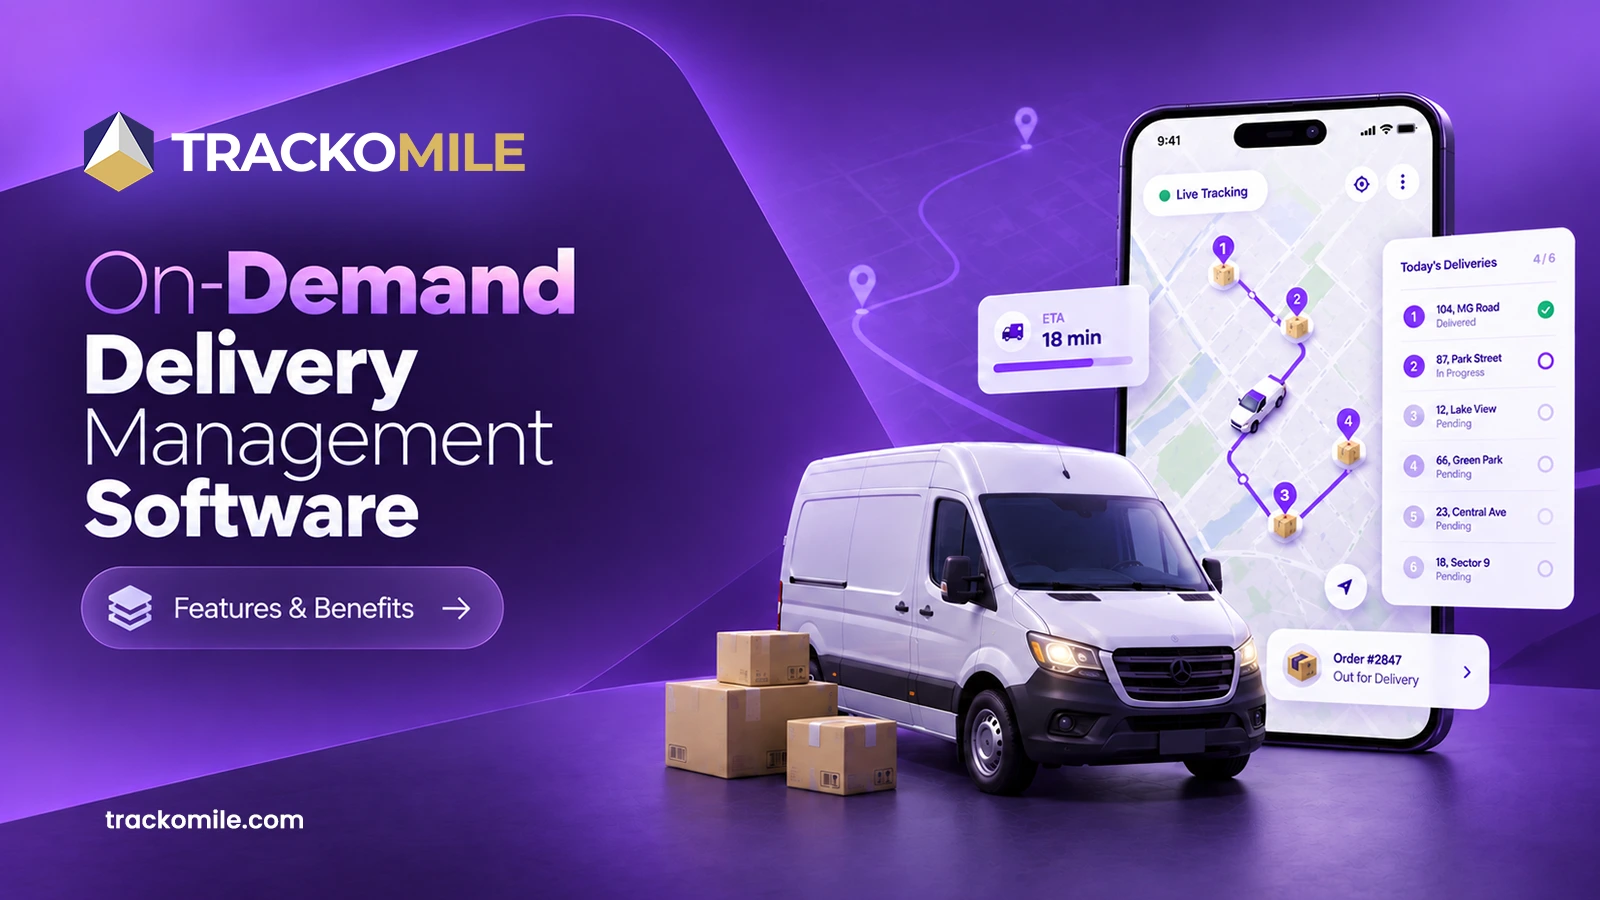
What is On-Demand Delivery Management Software: Types, Features, & Benefits
This blog explores on-demand delivery management software, its key benefits, and must-have features. Also, we will explore how to choose…


Your inbox awaits a welcome email. Stay tuned for the latest blog updates & expert insights.
"While you're here, dive into some more reads or grab quick bites from our social platforms!"Stay Updated on tech, telematics and mobility. Don't miss out on the latest in the industry.