


TrackoField has been our knight in shining armour, revolutionizing our field operations. We had a clear vision of where we headed but the challenge was to make it happen at a desirable pace. That’s where team TF stepped in along with TrackoBit to automate the entire field management including our fleet of vehicles. Today, we are operating in 6 regions and 14 cities with their software support.

Managing a diverse workforce across numerous sites is no small feat. TrackoField simplified our operations with intuitive attendance tracking, task allocation, and remote productivity monitoring. The app’s user-friendly interface made adoption seamless. No wonder our team has gotten addicted to TF.

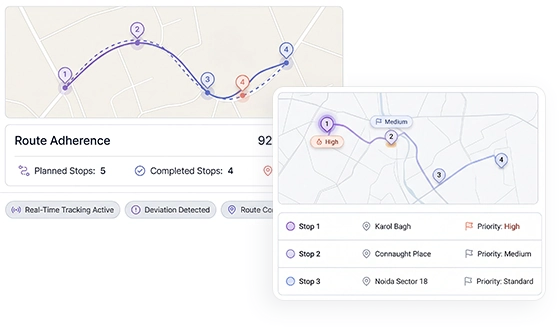
In the challenging terrain of remote UP, TrackoField’s custom forms, real-time tracking, and expense management proved invaluable. It streamlined our survey projects, offering a solution that was not just effective but tailored to our specific needs.
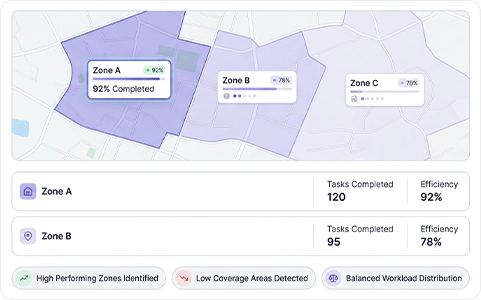
TrackoField became our ally in simplifying the complex task of mapping field agents. From remote task delegation to real-time location monitoring and insightful distance traveled reports, their collaboration has been instrumental in enhancing our operational efficiency.