
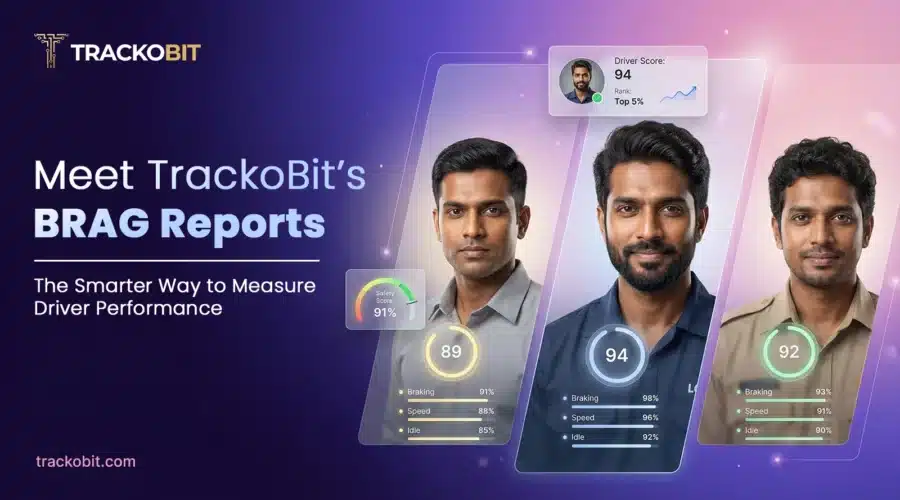
Quick Summary

- TrackoBit's BRAG Reports consolidate fleet data, enhancing driver performance insights and decision-making.
- BRAG categorizes performance into Blue, Green, Amber, and Red, indicating levels of driver behavior and safety metrics.
- The reports provide a clear overview of fleet operations, highlighting top performers and identifying areas needing attention.
- By standardizing metrics and focusing on key behaviors, BRAG Reports facilitate proactive risk control and effective driver training.
TrackoBit’s BRAG Report simplifies fleet data and driver behavior. It improves performance, reduces risks, and speeds up decisions.
Every fleet today runs on data, from trips and distance to driver behavior and safety events.
However, the challenge is not tracking this data but making sense of it, especially when it is spread across multiple reports and lacks clear structure.
Fleet managers are left asking simple questions:
- Which drivers are performing well?
- Where are the risks building up?
- What needs immediate attention?
That is where TrackoBit’s BRAG Reportschange the experience.
They bring your fleet data together and present it in a way that is clear, structured, and easy to act on.
Meet BRAG Reports Built for Instant Performance Visibility
BRAG Reports are built on a simple idea.
Fleet performance should be easy to understand at a glance.
BRAG stands for Blue, Red, Amber, and Green.
Each color represents a level of performance based on driver behavior and safety metrics.
- Blue indicates outstanding performance with minimal or no violations.
- Green reflects acceptable performance within defined limits.
- Amber highlights patterns that need attention.
- Red signals critical behavior that requires immediate action.
This classification is driven by real driving data.
Metrics like overspeeding, harsh acceleration, braking, and safety violations all contribute to a driver’s BRAG status. Instead of analyzing each parameter separately, BRAG Reports combine everything into one clear performance layer.
For example, if your fleet shows a higher share of Blue and Green drivers, it reflects strong discipline.
If Amber or Red categories begin to increase, it signals rising risk levels.
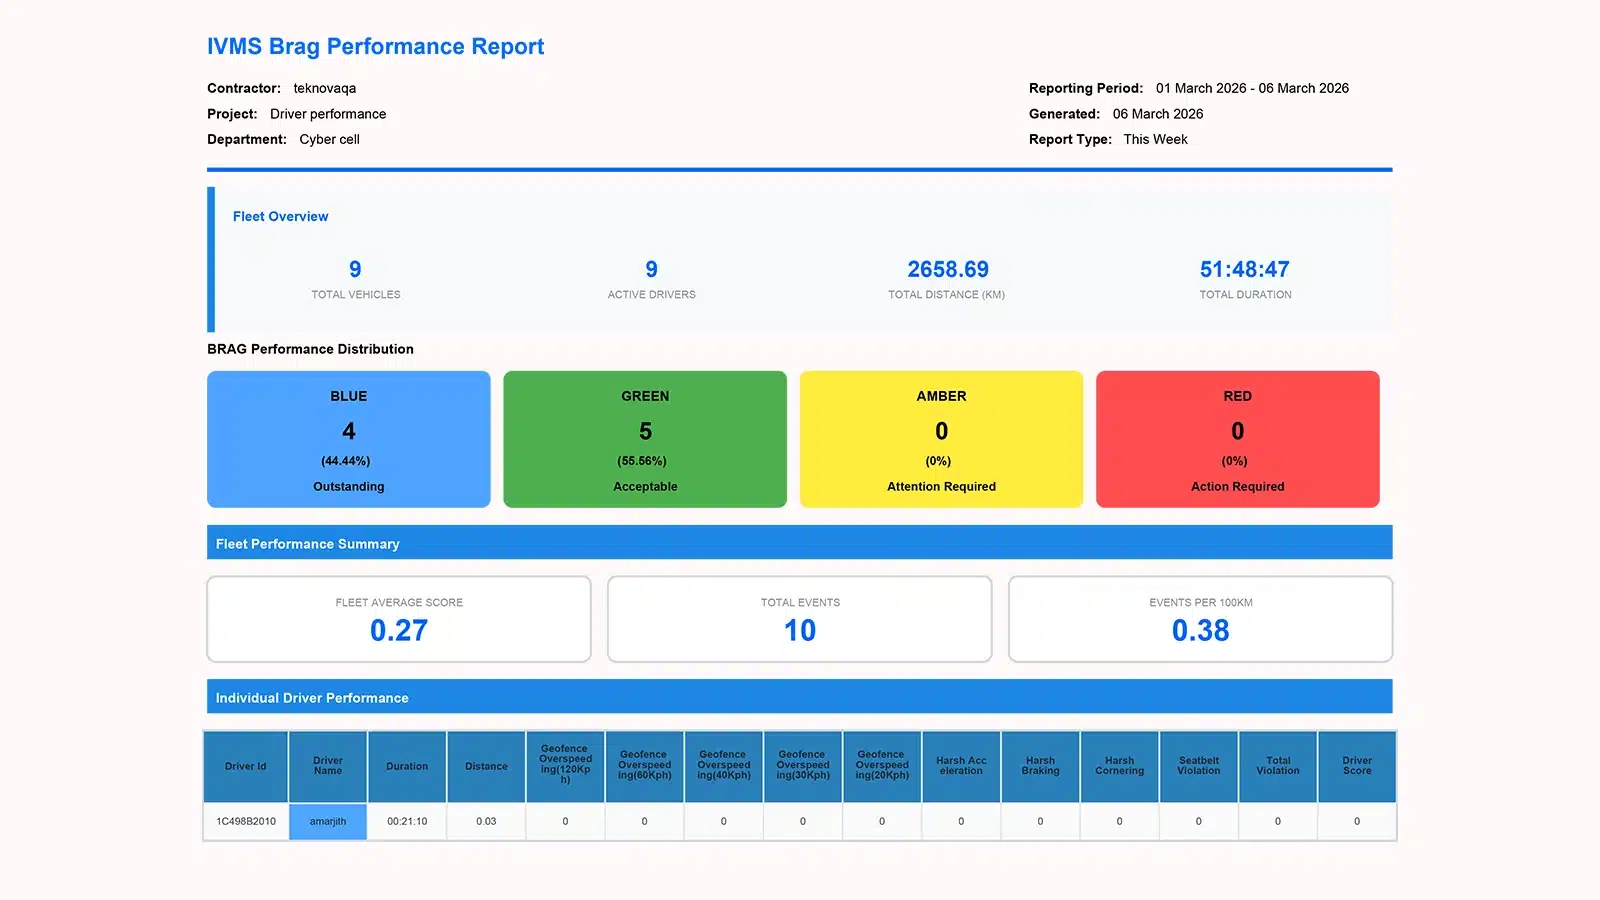
BRAG Report
What BRAG Reports Show You
BRAG Reports are designed to give you both a quick overview and detailed insights, without overwhelming you.
1. Fleet overview that sets the context
At the top level, you get a snapshot of your entire operation:
- Total vehicles in the fleet
- Number of active drivers
- Total distance covered
- Total driving duration
This gives you instant visibility into how your fleet is performing at scale.
2. Performance distribution that highlights priorities
The BRAG classification visually segments your fleet into performance categories.
This allows you to:
- Identify top-performing drivers instantly
- Recognize stable performers
- Detect drivers who need attention or intervention
No manual analysis is required, as the priorities are clear.
3. Driver behavior insights that drive safety
Each driver’s performance is backed by detailed behavioral data, including:
- Overspeeding across multiple thresholds
- Harsh acceleration and braking
- Harsh cornering patterns
- Seatbelt violations
These are the behaviors that directly impact safety, fuel efficiency, and vehicle health. By tracking them consistently, fleets gain better control over on-road performance.
4. Standardized metrics for fair evaluation
One of the biggest challenges in fleet management is comparing performance fairly.
BRAG Reports solve this using standardized metrics:
- Events per 100 km to normalize behavior
- Driver scores to summarize overall performance
This ensures that every driver is evaluated on the same scale, regardless of distance covered. It also helps teams track performance consistently over time.
Why BRAG Reports Make a Real Difference
BRAG Reports do more than organize data; they help you act on it with confidence. Here is how they create real impact:
1. Faster Decision-making
BRAG Reports show you what matters right away. You don’t have to go through multiple reports to understand driver performance.
2. Proactive Risk Control
You can spot risky driving early. This helps you act before it turns into a bigger issue.
3. Better Driver Accountability
When performance is clearly visible, drivers become more aware. They naturally start improving their behavior.
4. More Effective Training
You can focus on exact issues like overspeeding or harsh braking. This makes your training more relevant and useful.
Concluding Thoughts
Fleet performance is not just about tracking data; it is about understanding what that data means and acting on it at the right time. BRAG Reports make this easier by bringing all your key performance insights into one clear view, so you can quickly identify what is working and what needs attention.
With this level of clarity, decisions become faster and more confident, and actions become more focused. Over time, this leads to better driver behavior, stronger compliance, and smoother fleet operations.
If you are using TrackoBit, BRAG Reports are your next step forward.

Frequently Asked Questions
-
What is a BRAG report in fleet management?
TrackoBit’s BRAG report helps measure fleet driver performance. It categorizes performance into Blue, Green, Amber, and Red. BRAG reports make a real difference in fleet performance with accountability and decision-making.
-
What does BRAG stand for in fleet management?
BRAG stands for Blue, Red, Amber, and Green. These colors indicate multiple performance insights in a single report. Metrics like harsh braking, speeding, and safety violations impact BRAG status.
-
What metrics are included in a BRAG report?
BRAG reports include key driver behavior metrics. These are over speeding, harsh acceleration, and strong braking. They also use events/100km and driver scores. This helps standardize and summarize driver performance.
-
What do the Blue, Green, Amber, and Red categories mean in a BRAG report?
Blue indicates outstanding. Green indicates acceptance. Amber indicates patterns that need attention. Red indicates critical behaviors that need instant attention. These color-coded categories make it easier to quickly assess driver performance. It also helps spot areas which require attention.

Tithi Agarwal is an established content marketing specialist with years of experience in Telematics and the SaaS domain. With a strong background in literature and industrial expertise in technical wr... Read More


Related Blog
Safer Alerts, Shareable History, Faster Maintenance in TrackoBit
TrackoBit now adds an Evidence Model and authority-based access for ADAS and DMS alerts in video telematics, Vehicle History Sharing…
Fleet Management Requirements: The Complete Guide for 2026
Every wondered what exactly fleet management requirements are? Or, why do they matter? This guide helps you understand in detail.
7 Fleet Management Best Practices Every Fleet Manager Needs
Learn 7 fleet management best practices to improve safety, vehicle utilization, efficiency, and fleet performance in 2026.
What Are the Roles and Responsibilities of a Fleet Owner?
Behind every well-run fleet is a fleet owner juggling tasks like vehicle maintenance and driver management without letting anything fall…


Your inbox awaits a welcome email. Stay tuned for the latest blog updates & expert insights.
"While you're here, dive into some more reads or grab quick bites from our social platforms!"Stay Updated on tech, telematics and mobility. Don't miss out on the latest in the industry.